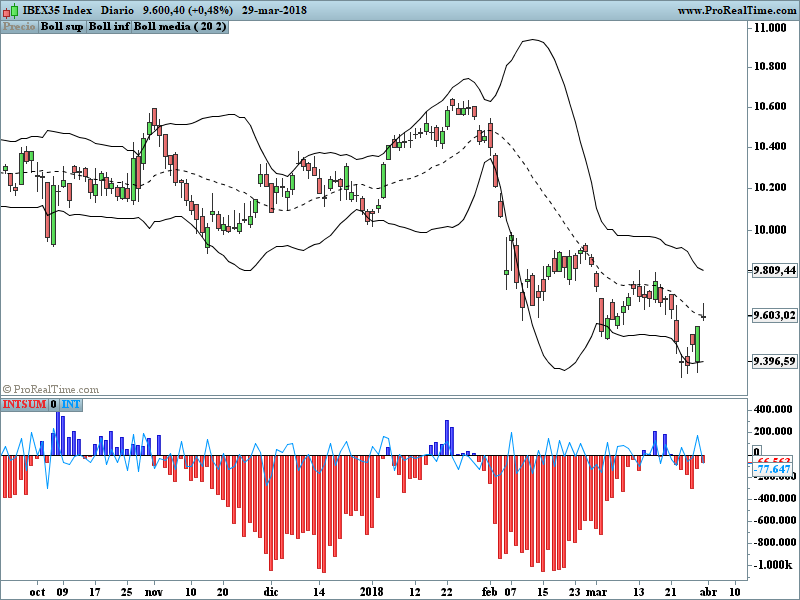
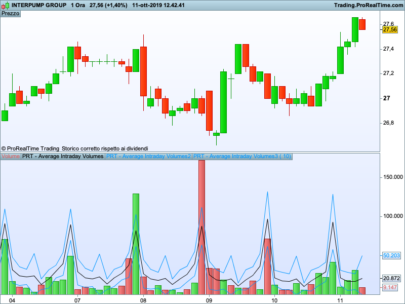
DEFINITION of ‘Intraday Intensity Index’
A volume based indicator that depicts the flow of funds for a security according to where it closes in its high and low range.
This indicator was developed by Dave Bostian. Its goal is to track the activity of institutional block traders.
A technical indicator that approximates the volume of trading for a specified security in a given day. It is designed to help track the activity of institutional block traders and is calculated by subtracting the day’s high and low from double the closing price, divided by the volume and multiplied by the difference between the high and the low.
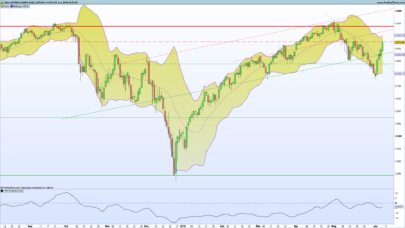
John Bollinger advised to use this indicator as a confirmation tool with the Bollinger Bands.
this indicator is an adaptation for the platform Prorealtime v10.3 of a Tradingview code.
|
1 2 3 4 5 6 7 8 9 10 11 12 13 14 15 16 17 18 19 20 21 22 23 24 25 26 27 28 |
REM INTRADAY INTENSITY INDEX //@version=3 //developer: David Bostian //author: KIVANÇ @fr3762 on twitter ////adapted for Prorealtime v10.3 by bolsatrilera-2018 length=21 //"length", minval=1) K1=(2*close-high-low)*volume if high <> low then K2= high-low else K2=1 endif INT=K1/K2 INTSUM= summation[Length](INT) if INTSUM > 0 then r=0 g=0 b=255 alpha=200 else r=255 g=0 b=0 alpha=200 endif return INTSUM coloured(r,g,b,alpha)style(histogram)as "INTSUM",0 as "0",INT as "INT" |
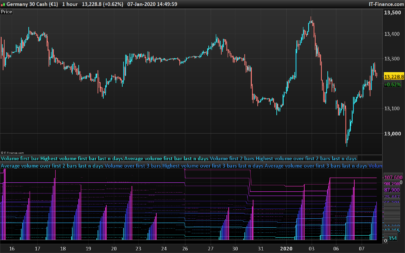
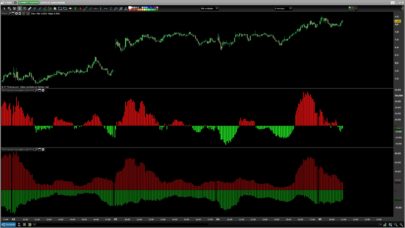
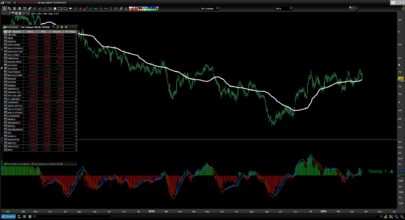
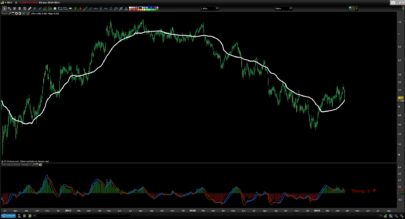
If price tags the lower BBand, look for IIIX has positive values to enter a trade.
Conversely; If price tags the upper BBand, look for IIIX has negative values to exit.
Share this
No information on this site is investment advice or a solicitation to buy or sell any financial instrument. Past performance is not indicative of future results. Trading may expose you to risk of loss greater than your deposits and is only suitable for experienced investors who have sufficient financial means to bear such risk.
ProRealTime ITF files and other attachments :
Find other exclusive trading pro-tools on ![]()
PRC is also on YouTube, subscribe to our channel for exclusive content and tutorials


If price tags the lower BBand, look for IIIX has positive values to enter a trade.
Conversely; If price tags the upper BBand, look for IIIX has negative values to exit.
A qué te refieres con esto? cuando el precio llega a la banda superior o inferior de las BB Bands esperar a que se den 7 barras positivas o negativas dependiendo, para abrir trade?
Gracias y un saludo