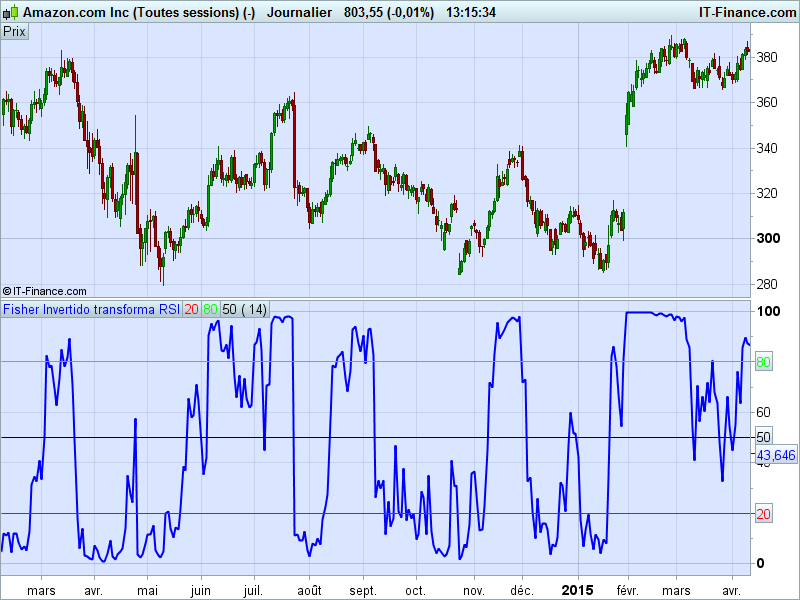
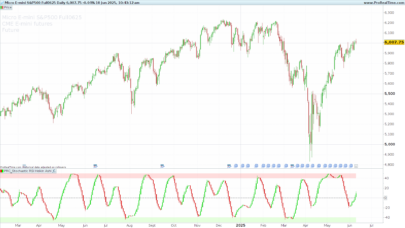
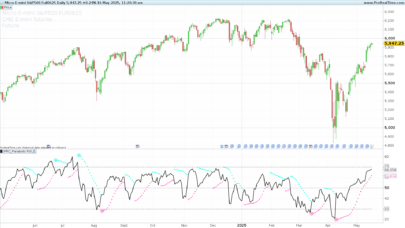
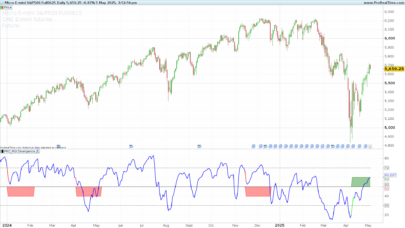
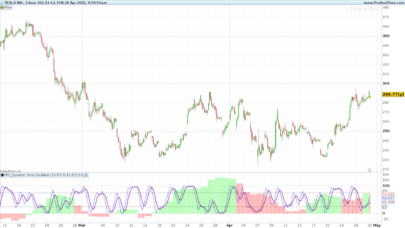
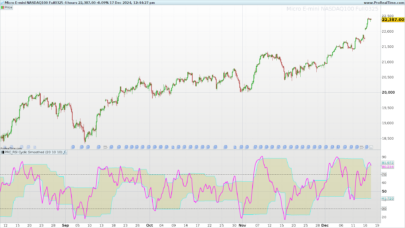
Developed by John Ehlers, the RSI-based inverse Fisher Transform is used to help clearly define trigger points.
The normal RSI indicator is calculated and adjusted so that the values are centered around zero. The inverse transform is then applied to these values.
John Ehlers recommend to smooth the result of the calculation with a weighted average, but that’s not the case into this one.
The default RSI period is set to 14.
|
1 2 3 4 5 6 7 8 9 10 11 12 13 |
/// Variable N = Núm. de velas para calcular el RSI = 14 /// Fisher invertido en histograma /// variable N puede modificarse a gusto de cada uno. ind=RSI[N](close) x=0.1*(ind-50) y=(EXP(2*x)-1)/(EXP(2*x)+1) ynorma=50*(y+1) RETURN ynorma COLOURED (0, 0, 255) AS"Fisher Invertido transforma RSI", 20 COLOURED (255, 0, 0) AS"20", 80 COLOURED (0, 255, 0) AS"80", 50 COLOURED (0,0,0)AS"50" |
Share this
No information on this site is investment advice or a solicitation to buy or sell any financial instrument. Past performance is not indicative of future results. Trading may expose you to risk of loss greater than your deposits and is only suitable for experienced investors who have sufficient financial means to bear such risk.
ProRealTime ITF files and other attachments :PRC is also on YouTube, subscribe to our channel for exclusive content and tutorials
