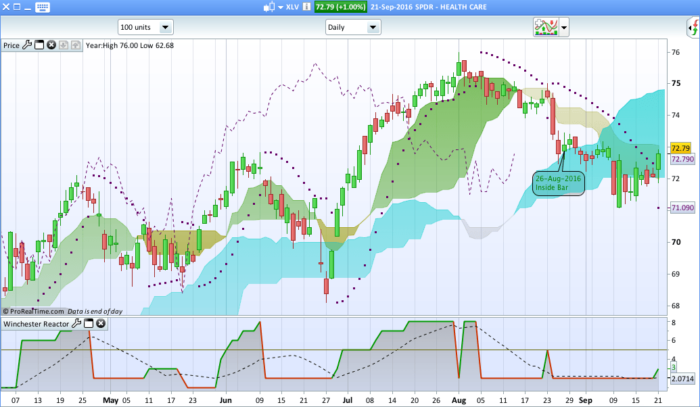
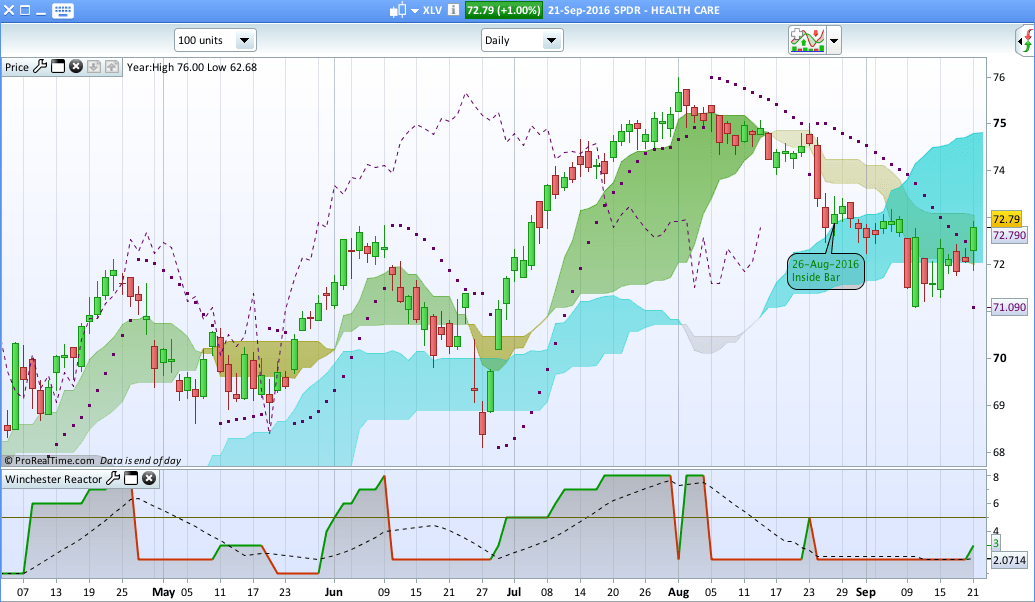
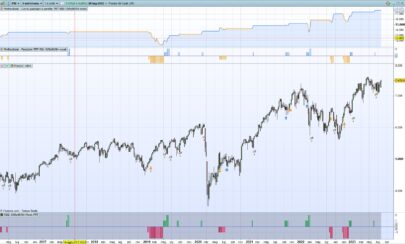
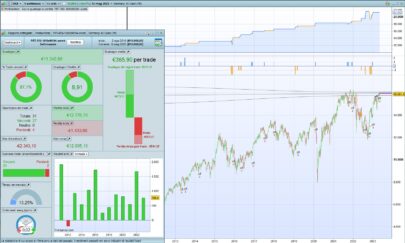
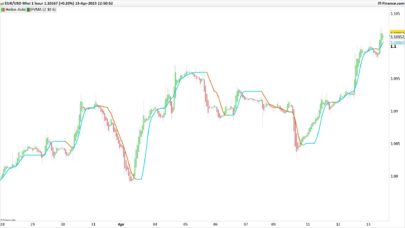
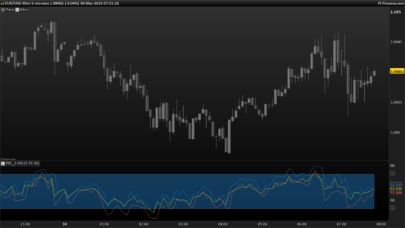
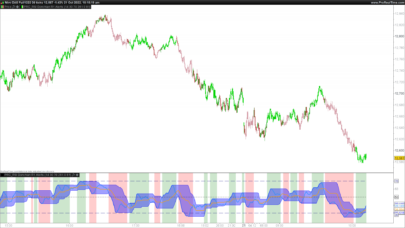
This is an updated version of this indicator which now incorporates elements of Ichimoku Kinko Hyo into the equation.
This was the original description:
“The program allocates points to a running total when the conditions of an indicator are reached Scores are between 1-5 as follows: 1 – Ranging Market. Do not trade 2 – Trend may be forming. Do not trade 3 – Early stages of trend. Monitor 4 – Trending Market. Trade 5 – Strong Trending Market. Trade”
The changes are as follows:
- The EMA’s have been replaced by the Tenkan Sen and Kijun Sen
- The Chikou Span has been introduced
- RSI limits have been introduced
- There are now eight levels which can be set based upon the number of events which are adhered to
When a level of 5 is reached it establishes a trend and a potential trade. Levels 6, 7 and 8 show an increase in the trend. Below 5 is considered not tradable. Note these levels apply to both long and short trades.
The attached screenshot also incorporates a 14 day moving average giving a clearer indication of an increase in trend.
|
1 2 3 4 5 6 7 8 9 10 11 12 13 14 15 16 17 18 19 20 21 22 23 24 25 26 27 28 29 30 31 32 33 34 35 36 37 38 39 40 41 42 43 44 45 46 47 48 49 50 51 52 53 54 55 56 57 58 59 60 61 62 63 64 65 66 |
// Declaration of Indicators Indicator2 = ADX[14] Indicator3 = DIplus[14](close) Indicator4 = DIminus[14](close) Indicator5 = SAR[0.02,0.02,0.2] Indicator6 = CALL "Ichimoku Tenkan Sen" Indicator7 = CALL "Ichimoku Kijun Sen" Indicator8 = RSI[14](close) indicator9 = close [26] //Chikou Span indicator10 = close //Events Event1 = RSI[14](close) <=70 //RSI below 70 Event2 = Indicator2 >= 15 Event3 = close > Indicator5 //Price above SAR Event4 = Indicator3 > Indicator4 //DI+ above DI- Event5 = (indicator10 > indicator9) //Chikou Span above Close Event6 = Indicator6 > Indicator7 //Tenkan above Kijun Event7 = ADX[14] >= 20 //ADX above 20 Event8 = ADX[14] >= 25 //ADX above 25 Event9 = close < Indicator5 //Price below SAR Event10 = Indicator3 < Indicator4 //DI+ below DI- Event11 = (indicator9 > indicator10) //Chikou Span below Close Event12 = Indicator6 < Indicator7 //Tenkan below Kijun Event13 = Indicator8 >=30 //RSI above 30 // Detection of bullish and bearish engulfing lines IF Event8 AND Event7 AND Event6 AND Event5 AND Event4 AND Event3 AND Event2 AND Event1 THEN Score = 8 ELSIF Event7 AND Event6 AND Event5 AND Event4 AND Event3 AND Event2 AND Event1 THEN Score = 7 ELSIF Event6 AND Event5 AND Event4 AND Event3 AND Event2 AND Event1 THEN Score = 6 ELSIF Event5 AND Event4 AND Event3 AND Event2 AND Event1 THEN Score = 5 ELSIF Event4 AND Event3 AND Event2 AND Event1 THEN Score = 4 ELSIF Event3 AND Event2 AND Event1 THEN Score = 3 ELSIF Event2 AND Event1 THEN Score = 2 ELSIF Event1 THEN Score = 1 ELSIF Event8 AND Event7 AND Event12 AND Event11 AND Event10 AND Event9 AND Event2 AND Event13 THEN Score = 8 ELSIF Event7 AND Event12 AND Event11 AND Event10 AND Event9 AND Event2 AND Event13 THEN Score = 7 ELSIF Event12 AND Event11 AND Event10 AND Event9 AND Event2 AND Event13 THEN Score = 6 ELSIF Event11 AND Event10 AND Event9 AND Event2 AND Event13 THEN Score = 5 ELSIF Event10 AND Event9 AND Event2 AND Event13 THEN Score = 4 ELSIF Event9 AND Event2 AND Event13 THEN Score = 3 ELSIF Event2 AND Event13 THEN Score = 2 ELSIF Event13 THEN Score = 1 ELSE Score = 0 ENDIF RETURN Score |
Share this
No information on this site is investment advice or a solicitation to buy or sell any financial instrument. Past performance is not indicative of future results. Trading may expose you to risk of loss greater than your deposits and is only suitable for experienced investors who have sufficient financial means to bear such risk.
ProRealTime ITF files and other attachments :PRC is also on YouTube, subscribe to our channel for exclusive content and tutorials
