This indicators package will help you find an count Elliott Waves. They are based on Williams%R, 5 period or 10 period or 15 period.
Explanation from the original topic on forum:
It happens some years ago Elliott Wave International’s chief commodity analyst and “Futures Junctures Service” editor Jeffrey Kennedy” presented his Trend Analyzing Tool in a webinar. On Tuesday, 22 December 2009, EWI disclosed the formula to the public on their website.
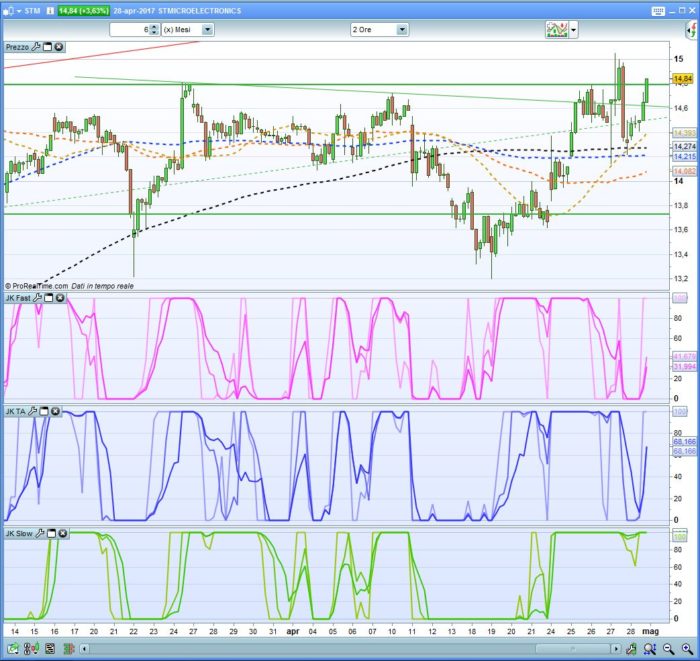
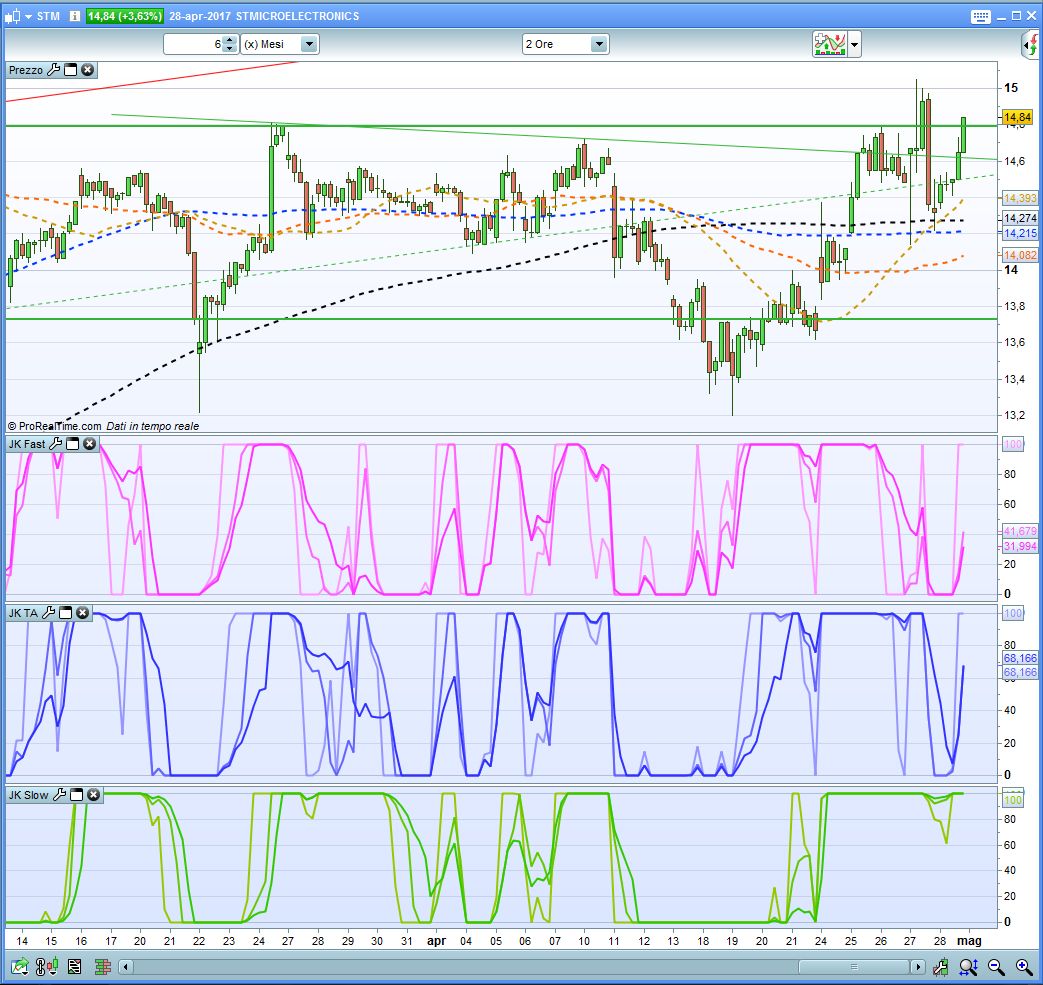
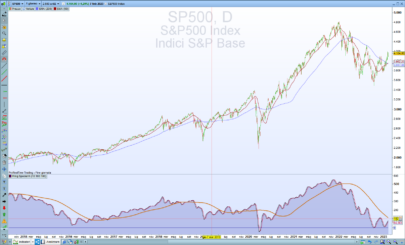
JK Fast Line measures the most immediate, near-term progression of a market’s trend and smallest degree of the Elliott wave structure.
JK Base Line measures the intermediate progression of a market’s trend.
JK Slow Line (not show on screen shot) measures the long-term progression of a market’s trend.
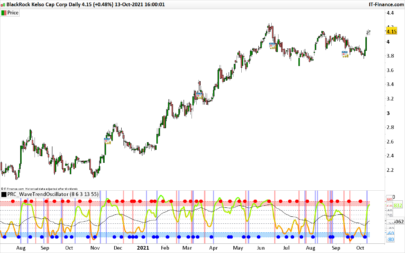
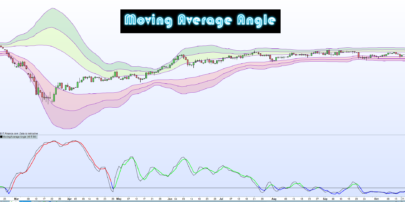
In the original JK_TA each panel of the indicator consists of three lines: a 5-period %R, a 10-period %R and a 15-period %R of the line concerned.
A reading of 100 indicates an uptrend. A reading of 0 indicates a downtrend.
The JK TA as such is as a proxy for clarifying the underlying Elliott wave structure:
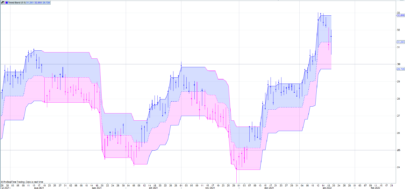
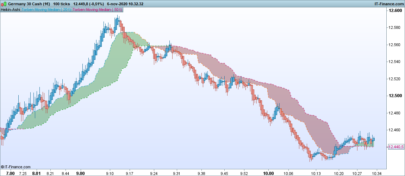
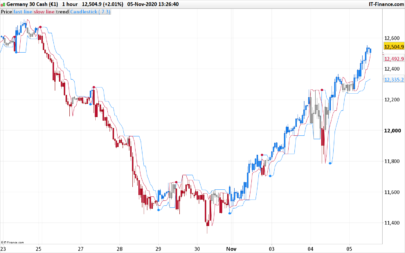
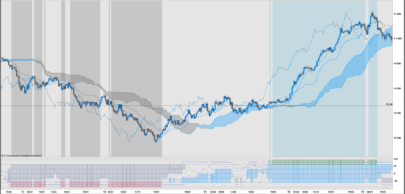
When all three lines in any version are flatlining (blended into one), it signals an impulsive, or motive, structure. See the blue lines in screen shot.
On the other hand, anytime you see the three lines separate, it’s a strong signal that the market is yielding a countertrend, or corrective pattern.
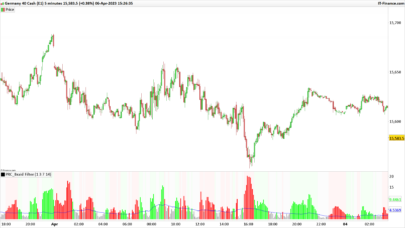
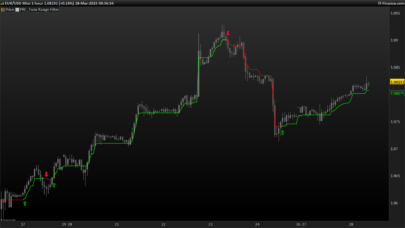
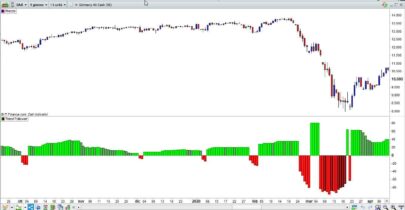
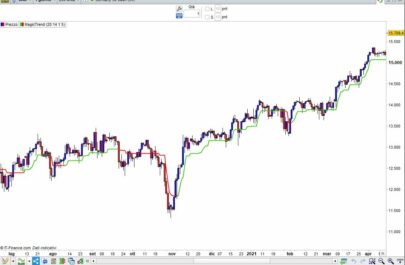
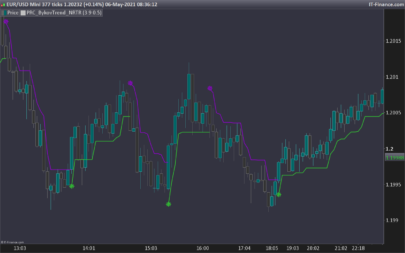
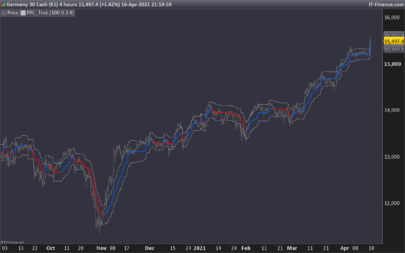
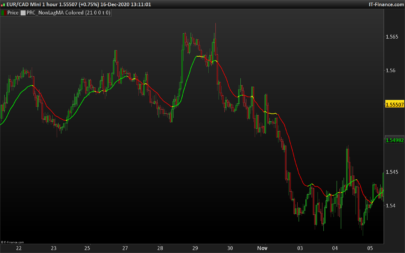
The JK_TA can be used on any instrument and on any time frame:
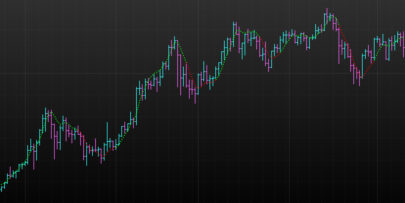
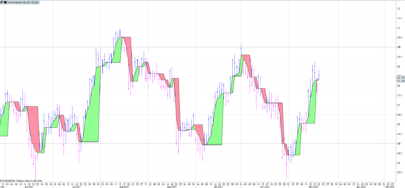
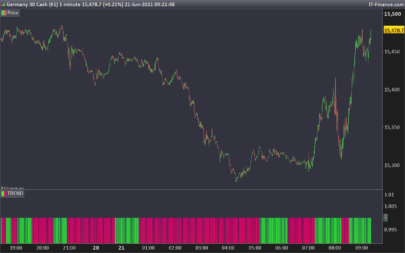
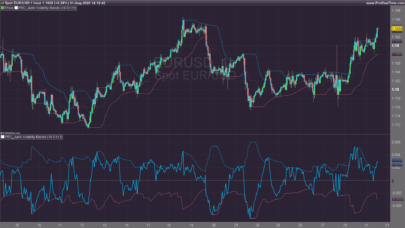
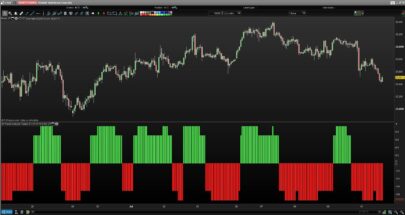
The first, second and third chart depict the basic indicator for different time frames. The fourth chart shows a custom variant of JK_TA: the Fast, Base and Slow lines packed together in one panel, selectable by the 5%R, 10%R or 15%R version of the three indicators.
https://www.prorealcode.com/topic/jeffrey-kennedy-trend-analyzer/
Combo indicator: (all indicators can be downloaded also separately at the end of this post).
|
1 2 3 4 5 6 7 8 9 10 11 12 13 14 15 16 17 18 19 20 21 22 23 24 25 26 27 28 29 30 31 32 33 34 35 36 37 38 39 40 41 42 43 44 45 46 47 48 49 50 51 52 53 54 55 56 57 58 59 60 61 62 63 64 65 66 67 68 69 70 71 72 73 74 75 76 77 78 79 80 81 82 83 84 85 86 87 88 89 90 91 92 93 94 95 96 97 |
//JKFast fastLength=5 slowLength=20 valuefast=ExponentialAverage[fastlength](close)-ExponentialAverage[slowlength](close) hv5 = Highest[5](valuefast) lv5 = Lowest[5](valuefast) if hv5 = lv5 then JKFast5=0 else JKFast5=((hv5 - valuefast) / (hv5 - lv5) * (-100) + 100) endif hv10 = Highest[10](valuefast) lv10 = Lowest[10](valuefast) if hv10 = lv10 then JKFast10=0 else JKFast10=((hv10 - valuefast) / (hv10 - lv10) * (-100) + 100) endif hv15 = Highest[15](valuefast) lv15 = Lowest[15](valuefast) if hv15 = lv15 then JKFast15=0 else JKFast15=((hv15 - valuefast) / (hv15 - lv15) * (-100) + 100) endif //JK TA valuebase=ExponentialAverage[fastlength](close) hv5 = Highest[5](valuebase) lv5 = Lowest[5](valuebase) if hv5 = lv5 then JKTA5=0 else JKTA5=((hv5 - valuebase) / (hv5 - lv5) * (-100) + 100) endif hv10 = Highest[10](valuebase) lv10 = Lowest[10](valuebase) if hv10 = lv10 then JKTA10=0 else JKTA10=((hv10 - valuebase) / (hv10 - lv10) * (-100) + 100) endif hv15 = Highest[15](valuebase) lv15 = Lowest[15](valuebase) if hv15 = lv15 then JKTA15=0 else JKTA15=((hv15 - valuebase) / (hv15 - lv15) * (-100) + 100) endif //JK Slow valueslow=ExponentialAverage[slowLength](close) hv5 = Highest[5](valueslow) lv5 = Lowest[5](valueslow) if hv5 = lv5 then JKSlow5=0 else JKSlow5=((hv5 - valueslow) / (hv5 - lv5) * (-100) + 100) endif hv10 = Highest[10](valueslow) lv10 = Lowest[10](valueslow) if hv10 = lv10 then JKSlow10=0 else JKSlow10=((hv10 - valueslow) / (hv10 - lv10) * (-100) + 100) endif hv15 = Highest[15](valueslow) lv15 = Lowest[15](valueslow) if hv15 = lv15 then JKSlow15=0 else JKSlow15=((hv15 - valueslow) / (hv15 - lv15) * (-100) + 100) endif Return JKFast5 coloured (255,150,255) as "JKFast5", JKFast10 coloured (255,100,255) as "JKFast10", JKFast15 coloured (255,50,255) as "JKFast15", JKSlow5 coloured (150,200,0) as "JKSlow5", JKSlow10 coloured (100,200,0) as "JKSlow10", JKSlow15 coloured (50,200,0) as "JKSlow15", JKTA5 coloured (150,150,255) as "JKTA5", JKTA10 coloured (100,100,255) as "JKTA10", JKTA15 coloured (50,50,255) as "JKTA15" |
Share this
No information on this site is investment advice or a solicitation to buy or sell any financial instrument. Past performance is not indicative of future results. Trading may expose you to risk of loss greater than your deposits and is only suitable for experienced investors who have sufficient financial means to bear such risk.
ProRealTime ITF files and other attachments :
Find other exclusive trading pro-tools on ![]()
PRC is also on YouTube, subscribe to our channel for exclusive content and tutorials


THX
looks good!
nice one , thank you
Hey! Does anyone have a pinescript (tradingview) code for this?