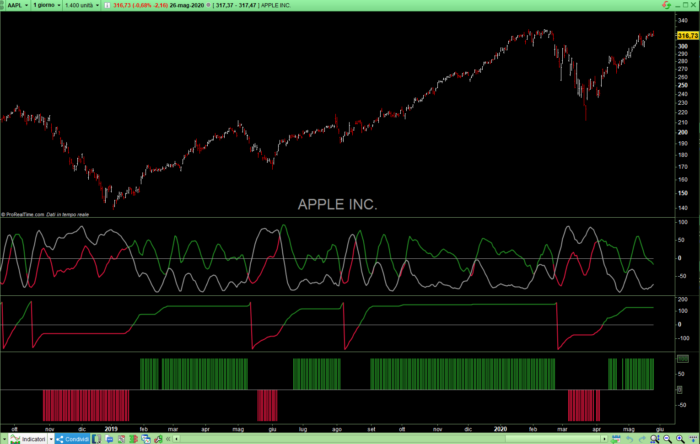
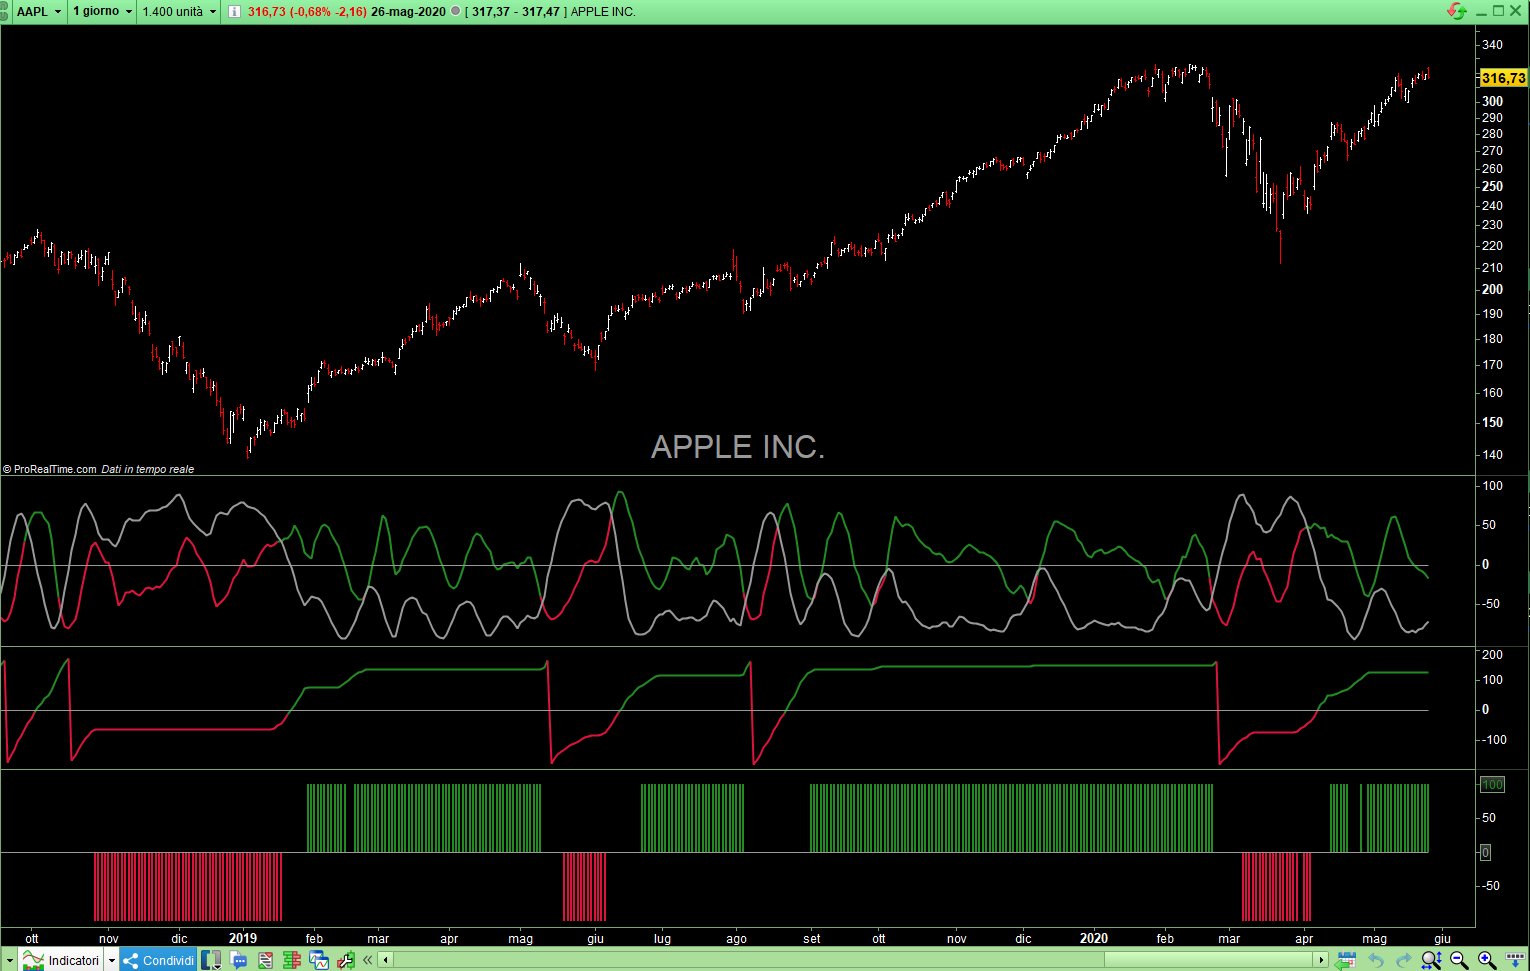
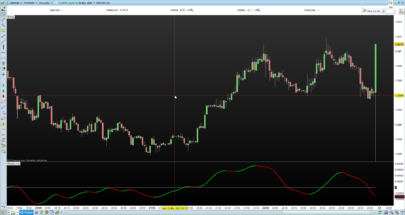
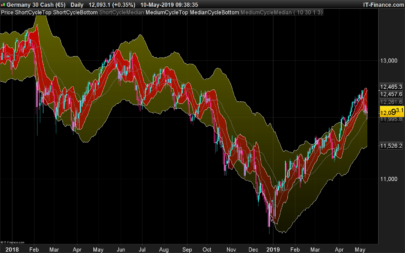
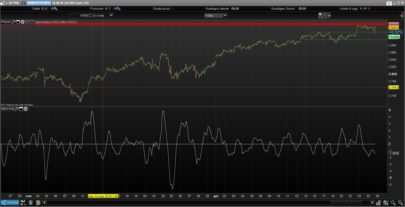
The Correlation Cycle Indicator was created by John Ehlers (Stocks & Commodities TASC). This particular indicator was designed for trend direction and trend strength and simply buy when it is green and sell when it turns red. Also keep in mind that the higher the indicator is above the signal then the stronger the trend and when they are close together, conditions get choppy.
|
1 2 3 4 5 6 7 8 9 10 11 12 13 14 15 16 17 18 19 20 21 22 23 24 25 26 27 28 29 30 31 32 33 34 35 36 37 38 39 40 41 42 43 44 45 46 47 48 49 50 51 52 53 54 55 56 57 58 59 60 61 62 63 64 65 66 67 68 69 70 71 72 73 74 75 76 77 78 79 80 81 82 83 84 85 86 87 88 89 90 91 92 93 94 95 96 97 98 99 100 101 102 103 104 105 106 107 108 109 110 111 112 113 114 115 116 117 118 119 120 121 122 123 124 125 126 127 128 129 130 131 132 133 134 135 136 137 138 139 140 141 142 143 144 145 146 147 |
// Indicator: Correlation Cycle // Correlation Angle Indicator // (C) 2013-2020 John F. Ehlers // TASC Jun 2020 // Inputs Setting Period = 14 InputPeriod = 0 // Uses price data if 0 ShowCycleIndicator = 1 // Booleano Indicator Mode ShowCycleIndex = 0 // Booleano Index Mode ShowPhasorAngle = 0 // Booleano Show Angle Phasor Mode ShowMarketState = 0 // Booleano Show Market State Mode //Correlate over one full cycle period Length = Period Price = customClose //Creates a theoretical sinusoid having an period equal to the input period as the data input if InputPeriod <> 0 then Price = Sin( 360 * Barindex / InputPeriod) endif //Correlate price with cosine wave having a fixed period Sx = 0 Sy = 0 Sxx = 0 Sxy = 0 Syy = 0 for Count = 1 to Length do X = Price[count - 1] Y = Cos( 360 * ( Count - 1 ) / Period ) Sx = Sx + X Sy = Sy + Y Sxx = Sxx + X * X Sxy = Sxy + X * Y Syy = Syy + Y*Y next if ( Length*Sxx - Sx*Sx > 0) and ( Length*Syy - Sy*Sy > 0 ) then Real = ( Length*Sxy - Sx*Sy ) / SQRT( ( Length*Sxx - Sx*Sx ) * ( Length*Syy - Sy*Sy ) ) endif //Correlate with a negative sine wave having a fixed period Sx = 0 Sy = 0 Sxx = 0 Sxy = 0 Syy = 0 for Count = 1 to Length do X = Price[count - 1] Y = -Sin( 360 * ( count - 1 ) / Period ) Sx = Sx + X Sy = Sy + Y Sxx = Sxx + X * X Sxy = Sxy + X * Y Syy = Syy + Y * Y next if ( Length*Sxx - Sx*Sx > 0 ) and ( Length*Syy - Sy*Sy > 0 ) then Imag = ( Length*Sxy - Sx*Sy ) / SqRt( ( Length*Sxx - Sx*Sx ) *( Length*Syy - Sy*Sy ) ) endif //Compute the angle as an arctangent function and resolve ambiguity if Imag <> 0 then Angle = 90 + Atan( Real / Imag ) Endif if Imag > 0 then Angle = Angle - 180 Endif //Do not allow the rate change of angle to go negative if Angle[1] - Angle < 270 and Angle < Angle[1] then Angle = Angle[1] Endif //Compute and plot market state State = 0 if Abs( Angle - Angle[1] ) < 9 and Angle <= 0 then State = -1 Endif if Abs( Angle - Angle[1] ) < 9 and Angle >= 0 then State = 1 Endif If ShowCycleIndicator Then Realshow = (((real+1)/2)*200)-100 Imagshow = (((Imag+1)/2)*200)-100 r=169 g=169 b=169 if Realshow>Imagshow then r=34 g=139 b=34 elsif Realshow<Imagshow then r=220 g=20 b=60 endif ZeroLine = 0 Endif If ShowCycleIndex Then Realshow = (((real+1)/2)*100) Imagshow = (((Imag+1)/2)*100) r=169 g=169 b=169 if Realshow>Imagshow then r=34 g=139 b=34 elsif Realshow<Imagshow then r=220 g=20 b=60 endif ZeroLine = 50 Endif If ShowPhasorAngle Then AngleShow = Angle if AngleShow>0 then r=34 g=139 b=34 elsif AngleShow<0 then r=220 g=20 b=60 endif ZeroLine = 0 Endif If ShowMarketState Then StateShow = State*100 if StateShow>0 then r=34 g=139 b=34 elsif StateShow<0 then r=220 g=20 b=60 Endif ZeroLine = 0 Endif Return Realshow coloured(r,g,b) as "Real", Imagshow coloured(153,153,153) as "Imag" ,AngleShow coloured(r,g,b) as "Phasor", StateShow coloured(r,g,b) Style(Histogram,1) as "Correlation Cycle Ind", ZeroLine coloured(153,153,153) as "Zero Line" |
Share this
No information on this site is investment advice or a solicitation to buy or sell any financial instrument. Past performance is not indicative of future results. Trading may expose you to risk of loss greater than your deposits and is only suitable for experienced investors who have sufficient financial means to bear such risk.
ProRealTime ITF files and other attachments :PRC is also on YouTube, subscribe to our channel for exclusive content and tutorials


Merci pour ce partage. Semble prometteur en Trendfollowing.
Cependant, une partie du code semble être en double, et un paramètre P3 initialisé à 64 semble ne pas servir.
Bonne journée.
Thanks. I would like if possible some further explanation and clarification on the P3 (64) not used.thxs
Hi Actarus,
Thanks for the code !
To get the picture as attached above from the indicator you need to switch on (set to 1) all, at the Input settings , yes ? So far I did not tested it, just assuming.
// Inputs Setting
Period = 14
InputPeriod = 0 // Uses price data if 0
ShowCycleIndicator = 1 // Booleano Indicator Mode –> 1 OK
ShowCycleIndex = 0 // Booleano Index Mode –> 1, change
ShowPhasorAngle = 0 // Booleano Show Angle Phasor Mode –> 1, change
ShowMarketState = 0 // Booleano Show Market State Mode –> 1, change
Caio Jan,
con ognuno dei setting ottieni un indicatore visualizzato diverso, ma tutti sono generati dallo stesso codice di base.
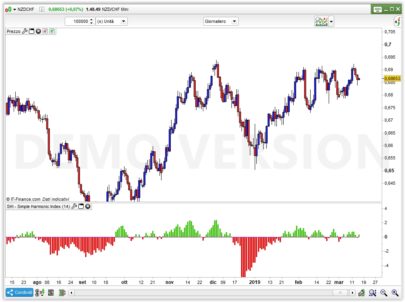
Hi Actarus, what’s the name of the histogram indicator below Apple’s chart?
Flag ShowState in setting and show histogram
hi, thank you for creating this indicator.
i can’t figure out how to get the three graphs below the apple chart like you did.
When i import this code i only get green and red lines on the apple chart and nothing below, how can i do that?