




More from ProRealCode
ProRealCode - Trading & Coding with ProRealTime™
The ProRealTime™ community on the web! Officially sharing ProRealTime knowledge to Worldwide users since 2015!



John Ehlers Instantaneous Trendline
August 27, 2018, 3:37 PM
Indicators
3 Comments
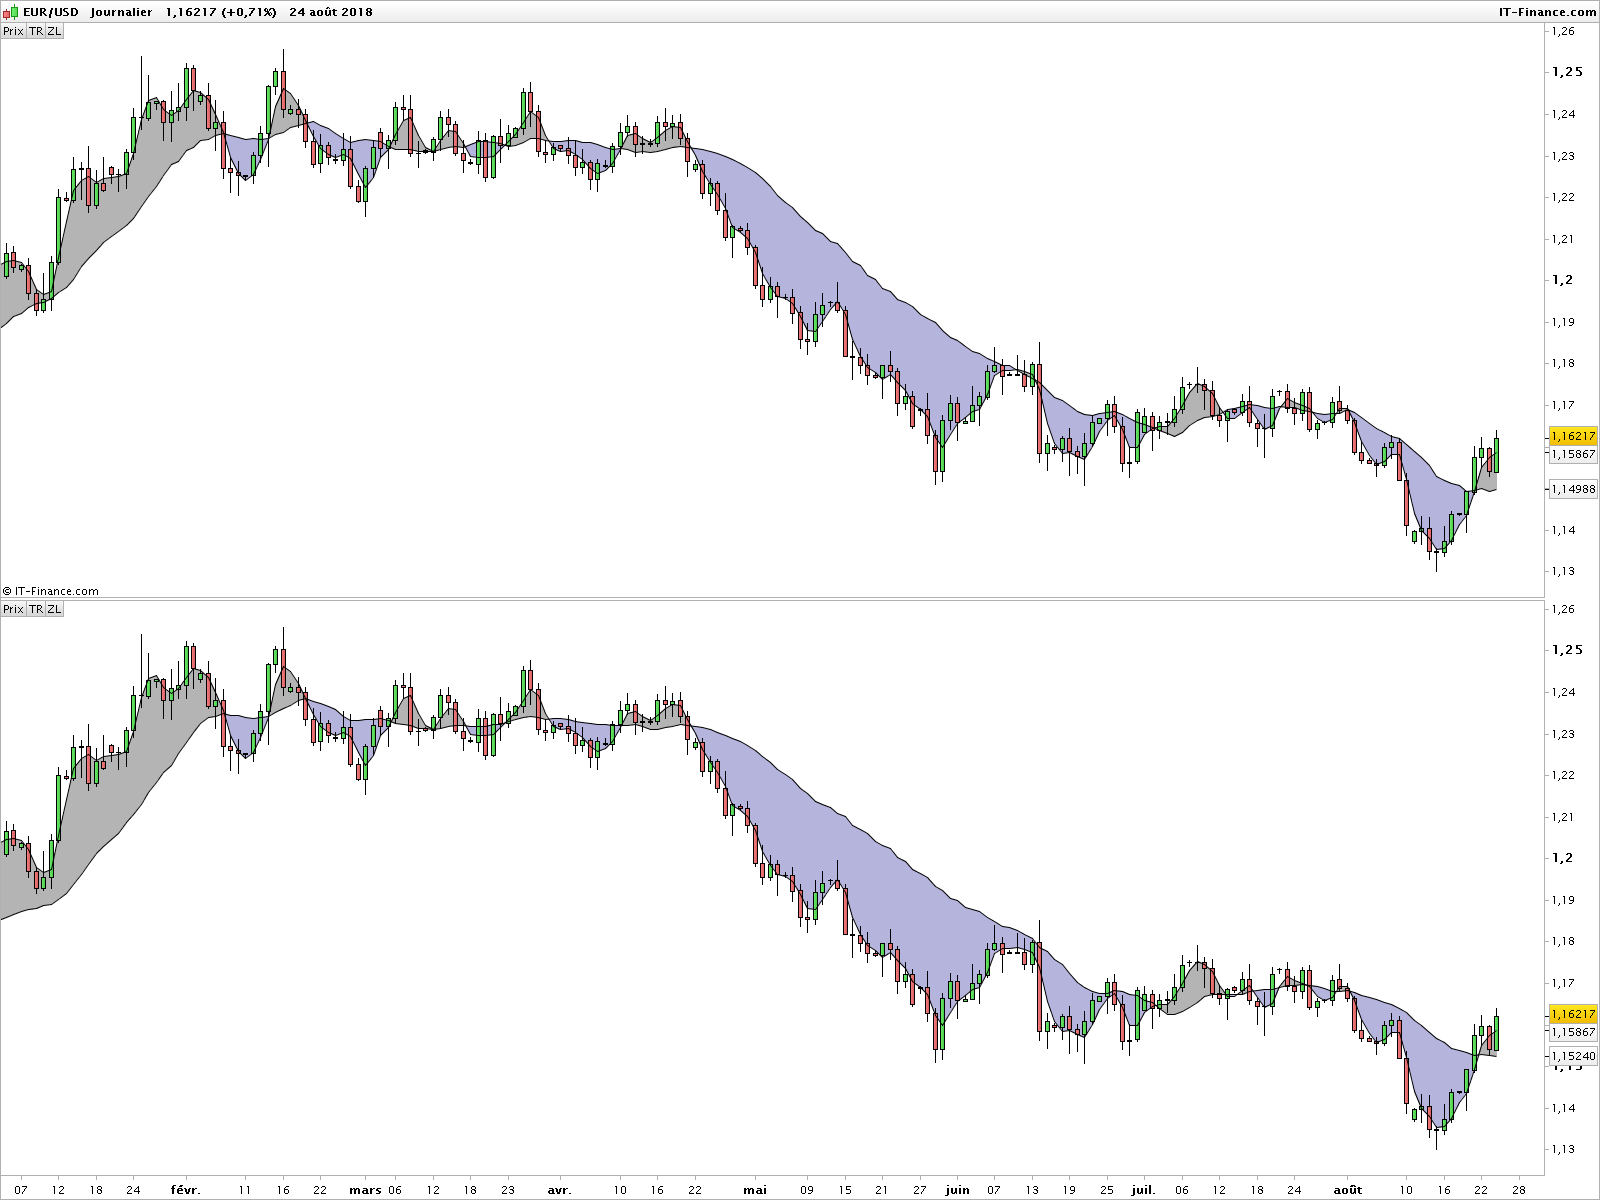
This is an implementation of John Ehlers’ Instantaneous Trendline, as described in Market Mode Strategies (1999-10-19).
The code has been slightly enhanced to return a Zero Lag exponential moving average, like it was done here.
// Instantaneous Trendline
// Market Mode Strategies
// 1999-10-19 John F. Ehlers
// http://www.jamesgoulding.com/Research_II/Ehlers/Ehlers%20(Market%20Mode%20Strategies).doc

Price = (high+low)/2
Imult = .635
Qmult = .338

If BarIndex > 6 then

	// Detrend Price
	Value3 = Price - Price[7]

	// Compute InPhase and Quadrature components
 	Inphase = 1.25*(Value3[4] - Imult*Value3[2]) + Imult*InPhase[3]
	Quadrature = Value3[2] - Qmult*Value3 + Qmult*Quadrature[2]

	// Use ArcTangent to compute the current phase
	If ABS(InPhase + InPhase[1]) > 0 then
		a = ABS((Quadrature+Quadrature[1]) / (InPhase+InPhase[1]))
		Phase = ATAN(a)
	Endif

	// Resolve the ArcTangent ambiguity
	If InPhase < 0 and Quadrature > 0 then
		Phase = 180 - Phase
	Endif
	If InPhase < 0 and Quadrature < 0 then
		Phase = 180 + Phase
	Endif
	If InPhase > 0 and Quadrature < 0 then
		Phase = 360 - Phase
	Endif

	// Compute a differential phase, resolve phase wraparound, and limit delta phase errors
	DeltaPhase = Phase[1] - Phase
	If Phase[1] < 90 and Phase > 270 then
		DeltaPhase = 360 + Phase[1] - Phase
	Endif
	If DeltaPhase < 7 then
		DeltaPhase = 7
	Endif
	If DeltaPhase > 60 then
		DeltaPhase = 60
	Endif

	// Sum DeltaPhases to reach 360 degrees. The sum is the instantaneous period.
	InstPeriod = 0
	Value4 = 0
	For count = 0 to 40 do
		Value4 = Value4 + DeltaPhase[count]
		If Value4 > 360 and InstPeriod = 0 then
			InstPeriod = count
		Endif
	Next

	// Resolve Instantaneous Period errors and smooth
	If InstPeriod = 0 then
		InstPeriod = InstPeriod[1]
	Endif
	Value5 = .25*InstPeriod + .75*Value5[1]

	// Compute Trendline as simple average over the measured dominant cycle period
	Period = ROUND(Value5)
	Trendline = 0
	For count = 0 to Period + 1 do
		Trendline = Trendline + Price[count]
	Next
	If Period > 0 then
		Trendline = Trendline / (Period + 2)
	Endif

	Value11 = .33*(Price + .5*(Price - Price[3])) + .67*Value11[1]

	If barindex < 26 then
		Trendline = Price
		Value11 = Price
	Endif

Endif

Return Trendline as "TR", Value11 as "ZL"
A more recent formula of Hilbert Transform, described in Squelch those Whipsaws (2000-24-03), can be used, by replacing the beginning of the code with:
If BarIndex > 5 then

	// Compute InPhase and Quadrature components
	Value1 = Price - Price[6]
	Value2 = Value1[3]
	Value3 = .75*(Value1 - Value1[6]) + .25*(Value1[2] - Value1[4])
	InPhase = .33*Value2 + .67*InPhase[1]
	Quadrature = .2*Value3 + .8*Quadrature[1]
The attached screenshot shows the Instantaneous Trendline using original description (top) of and the alternative Hilbert Transform formula (bottom).
Download
Filename:
Ehlers-Instantaneous-Trendline.itf
Downloads:
342
Senior
Code artist, my biography is a blank page waiting to be scripted. Imagine a bio so awesome it hasn't been coded yet.
Author’s Profile
Similar code
Rising & Falling Wedge DetectorIndicators
ZeroLag MACD Divergence SignalsIndicators
Trend BreakoutStrategies

Loading...
Thanks Horance for porting this code to PRT. I would like to bring some speedup to your code. I've been willing to use it some strategies, but the computation time is disastrous when backtesting. I optimized some parts of the code. The resulting figures are unchanged, but it the code is 4 time quicker to compute. I did 2 optimizations : 1/ sum of deltaPhases can be computed more quickly if you observe that the current InstPeriod is close to the previous one. (which by the way is functionaly quite intutive). Therefore, we reuse the previous InstPeriod to compute the summation[InstPeriod](DeltaPhase) .Then we check if we went above or below 360, then we adjust the current InstPeriod with a few loops... On my machine, the code is twice faster on this part... 2/ averaging using the calculated period In PRT, loops are slow, very slow. We are much better off, if we use native function like average... The gain in speedup is approx a ratio of 4 on this part... I'm providing the full code below. Thanks again // Instantaneous Trendline // Market Mode Strategies // 1999-10-19 John F. Ehlers // http://www.jamesgoulding.com/Research_II/Ehlers/Ehlers%20(Market%20Mode%20Strategies).doc Price = (high+low)/2 Imult = .635 Qmult = .338 If BarIndex > 6 then // Detrend Price Value3 = Price - Price[7] // Compute InPhase and Quadrature components Inphase = 1.25*(Value3[4] - Imult*Value3[2]) + Imult*InPhase[3] Quadrature = Value3[2] - Qmult*Value3 + Qmult*Quadrature[2] // Use ArcTangent to compute the current phase If ABS(InPhase + InPhase[1]) > 0 then a = ABS((Quadrature+Quadrature[1]) / (InPhase+InPhase[1])) Phase = ATAN(a) Endif // Resolve the ArcTangent ambiguity If InPhase 0 then Phase = 180 - Phase Endif If InPhase < 0 and Quadrature 0 and Quadrature < 0 then Phase = 360 - Phase Endif // Compute a differential phase, resolve phase wraparound, and limit delta phase errors DeltaPhase = Phase[1] - Phase If Phase[1] 270 then DeltaPhase = 360 + Phase[1] - Phase Endif If DeltaPhase 60 then DeltaPhase = 60 Endif // Sum DeltaPhases to reach 360 degrees. The sum is the instantaneous period. InstPeriod = InstPeriod[1]+1 Value4 = summation[InstPeriod](DeltaPhase) if Value4 360 then if Value4 > 360 then while Value4 > 360 do InstPeriod = InstPeriod -1 Value4 = Value4 - DeltaPhase[InstPeriod] wend else while Value4 < 360 do Value4 = Value4 + DeltaPhase[InstPeriod] InstPeriod = InstPeriod + 1 wend InstPeriod = InstPeriod -1 endif endif // Resolve Instantaneous Period errors and smooth If InstPeriod = 0 then InstPeriod = InstPeriod[1] Endif SmoothPeriod = .25*InstPeriod + .75*SmoothPeriod[1] // Compute Trendline as simple average over the measured dominant cycle period Period = ROUND(SmoothPeriod) Trendline= average [Period + 2](Price) Value11 = .33*(Price + .5*(Price - Price[3])) + .67*Value11[1] If barindex < 26 then Trendline = Price Value11 = Price Endif Endif Return Trendline as "TR", Value11 as "ZL"