This is an implementation of John Ehlers’ Sinewave Indicator, as described in Market Mode Strategies (1999-10-19).
This is a different and earlier version of the Sinewave Indicator, from what is described in John Ehlers’ books Rocket Science for Traders (2001-07-20) and Cybernetic Analysis for Stocks and Futures (2004-03-29). However, this is the most popular version of the algorithm and seems to achieve better results.
|
1 2 3 4 5 6 7 8 9 10 11 12 13 14 15 16 17 18 19 20 21 22 23 24 25 26 27 28 29 30 31 32 33 34 35 36 37 38 39 40 41 42 43 44 45 46 47 48 49 50 51 52 53 54 55 56 57 58 59 60 61 62 63 64 65 66 67 68 69 70 71 72 73 74 75 76 77 78 79 80 81 82 83 84 85 86 87 88 |
// The Sinewave Indicator // Market Mode Strategies // 1999-10-19 John F. Ehlers // http://www.jamesgoulding.com/Research_II/Ehlers/Ehlers%20(Market%20Mode%20Strategies).doc Price = (high+low)/2 Imult = 0.635 Qmult = 0.338 If BarIndex > 6 then // Detrend Price Value3 = Price - Price[7] // Compute InPhase and Quadrature components Inphase = 1.25*(Value3[4] - Imult*Value3[2]) + Imult*InPhase[3] Quadrature = Value3[2] - Qmult*Value3 + Qmult*Quadrature[2] // Use ArcTangent to compute the current phase If ABS(InPhase + InPhase[1]) > 0 then a = ABS((Quadrature+Quadrature[1]) / (InPhase+InPhase[1])) Phase = ATAN(a) Endif // Resolve the ArcTangent ambiguity If InPhase < 0 and Quadrature > 0 then Phase = 180 - Phase Endif If InPhase < 0 and Quadrature < 0 then Phase = 180 + Phase Endif If InPhase > 0 and Quadrature < 0 then Phase = 360 - Phase Endif // Compute a differential phase, resolve phase wraparound, and limit delta phase errors DeltaPhase = Phase[1] - Phase If Phase[1] < 90 and Phase > 270 then DeltaPhase = 360 + Phase[1] - Phase Endif If DeltaPhase < 1 then DeltaPhase = 1 Endif If DeltaPhase > 60 then DeltaPhase = 60 Endif // Sum DeltaPhases to reach 360 degrees. The sum is the instantaneous period. InstPeriod = 0 Value4 = 0 For count = 0 to 40 do Value4 = Value4 + DeltaPhase[count] If Value4 > 360 and InstPeriod = 0 then InstPeriod = count Endif Next // Resolve Instantaneous Period errors and smooth If InstPeriod = 0 then InstPeriod = InstPeriod[1] Endif Value5 = .25*InstPeriod + .75*Value5[1] // Compute Dominant Cycle Phase, Sine of the Phase Angle, and Leadsine Period = ROUND(Value5) RealPart = 0 ImagPart = 0 For count = 0 to Period - 1 RealPart = RealPart + SIN(360 * count / Period) * (Price[count]) ImagPart = ImagPart + COS(360 * count / Period) * (Price[count]) Next If ABS(ImagPart) > 0.001 then DCPhase = ATAN(RealPart / ImagPart) Endif If ABS(ImagPart) <= 0.001 then DCPhase = 90 * SGN(RealPart) Endif DCPhase = DCPhase + 90 If ImagPart < 0 then DCPhase = DCPhase + 180 Endif If DCPhase > 315 then DCPhase = DCPhase - 360 Endif Endif Return Sin(DCPhase) as "Sine", Sin(DCPhase+45) as "LeadSine" |
A more recent formula of Hilbert Transform, described in Squelch those Whipsaws (2000-24-03), can be used, by replacing the beginning of the code with:
|
1 2 3 4 5 6 7 8 |
If BarIndex > 5 then // Compute InPhase and Quadrature components Value1 = Price - Price[6] Value2 = Value1[3] Value3 = .75*(Value1 - Value1[6]) + .25*(Value1[2] - Value1[4]) InPhase = .33*Value2 + .67*InPhase[1] Quadrature = .2*Value3 + .8*Quadrature[1] |
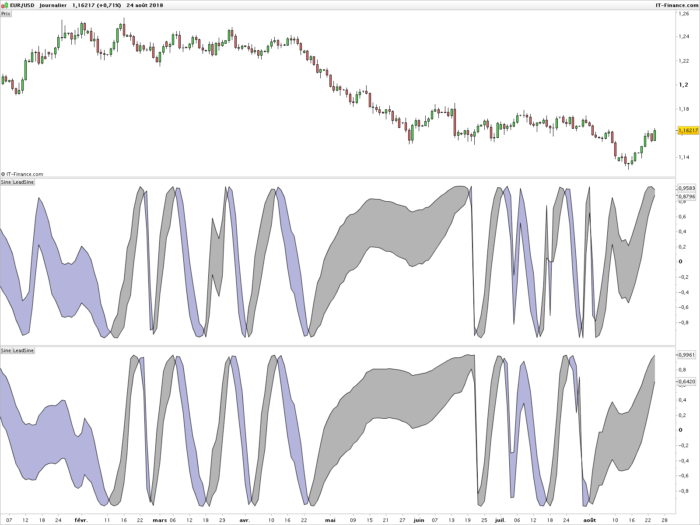
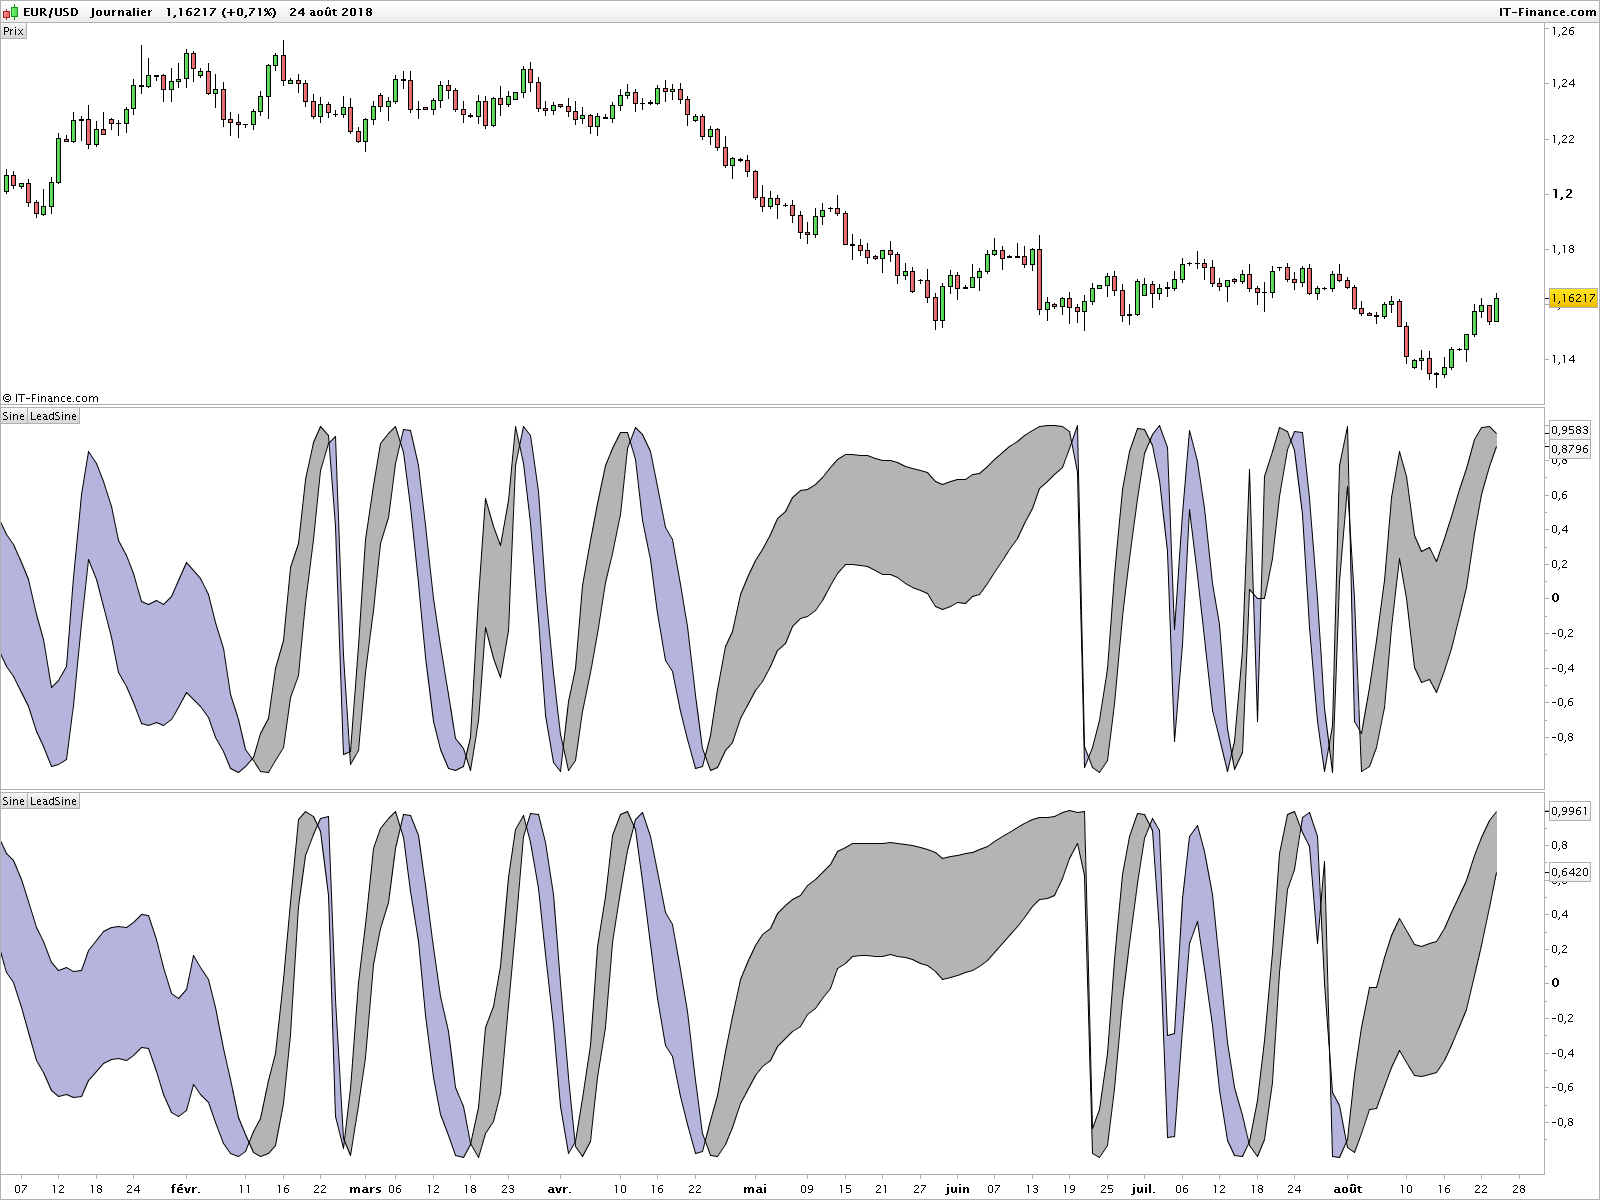
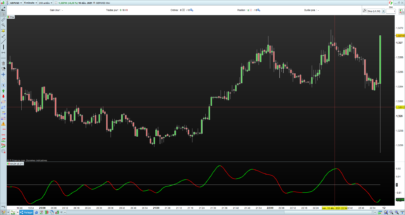
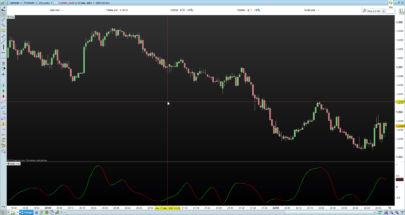
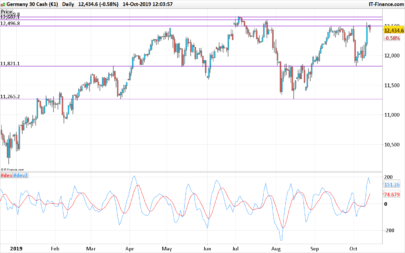
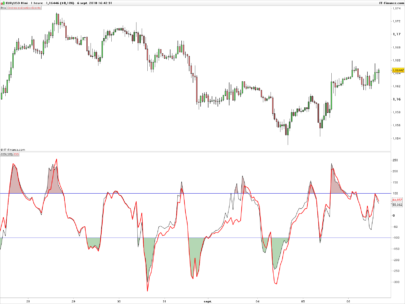
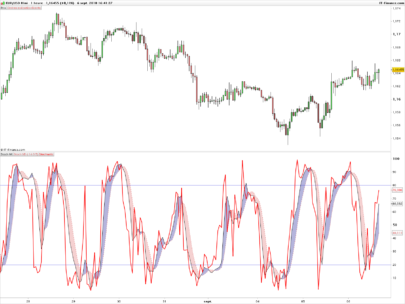
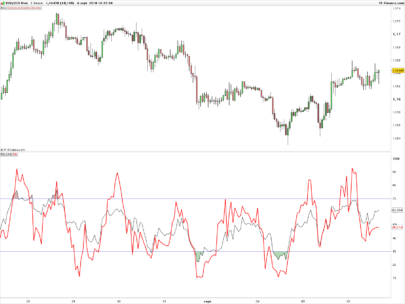
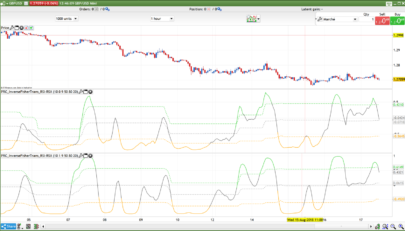
The attached screenshot shows the Sinewave Indicator using original description (top) of and the alternative Hilbert Transform formula (bottom).
Share this
No information on this site is investment advice or a solicitation to buy or sell any financial instrument. Past performance is not indicative of future results. Trading may expose you to risk of loss greater than your deposits and is only suitable for experienced investors who have sufficient financial means to bear such risk.
ProRealTime ITF files and other attachments :PRC is also on YouTube, subscribe to our channel for exclusive content and tutorials

Very interesting indicator. Any advice on identifying the transition between ranging and trending markets?
This is a good question. John Ehlers explains it in Rocket Science for Traders. You have to use the Sinewave Indicator in conjunction with the Instantaneous Trendline (https://www.prorealcode.com/prorealtime-indicators/john-ehlers-instantaneous-trendline/). Basically, when the trendline crosses the Kalman filter, we start to count the number of bars. While the number of bars is inferior to half a period, we stay in cycle mode, otherwise we enter trend mode.
Much appreciated, I will give that a try. Also, is there any criteria that one could use to identify whether if a sinewave cycle cross is valid? Perhaps the level of an RSI or Stochastic using the cycle period as calculated above?
Thanks for the code! I’m trying to understand how it works, and have a few questions… lines 16 & 17: howdoes InPhase[3] and Quadrature[2] have any values? Any indexes below 6 aren’t assigned. So, those values just return zero? Same with the Value3[4] array. What value does Value3[4] have from 4 bars ago? High? Low? Close? Nothing?
Thank you 🙂