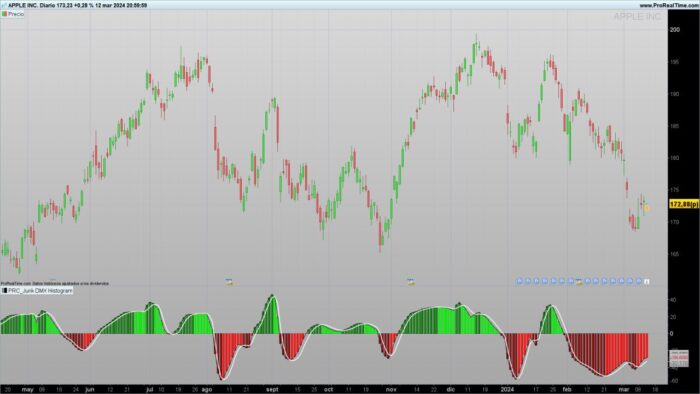
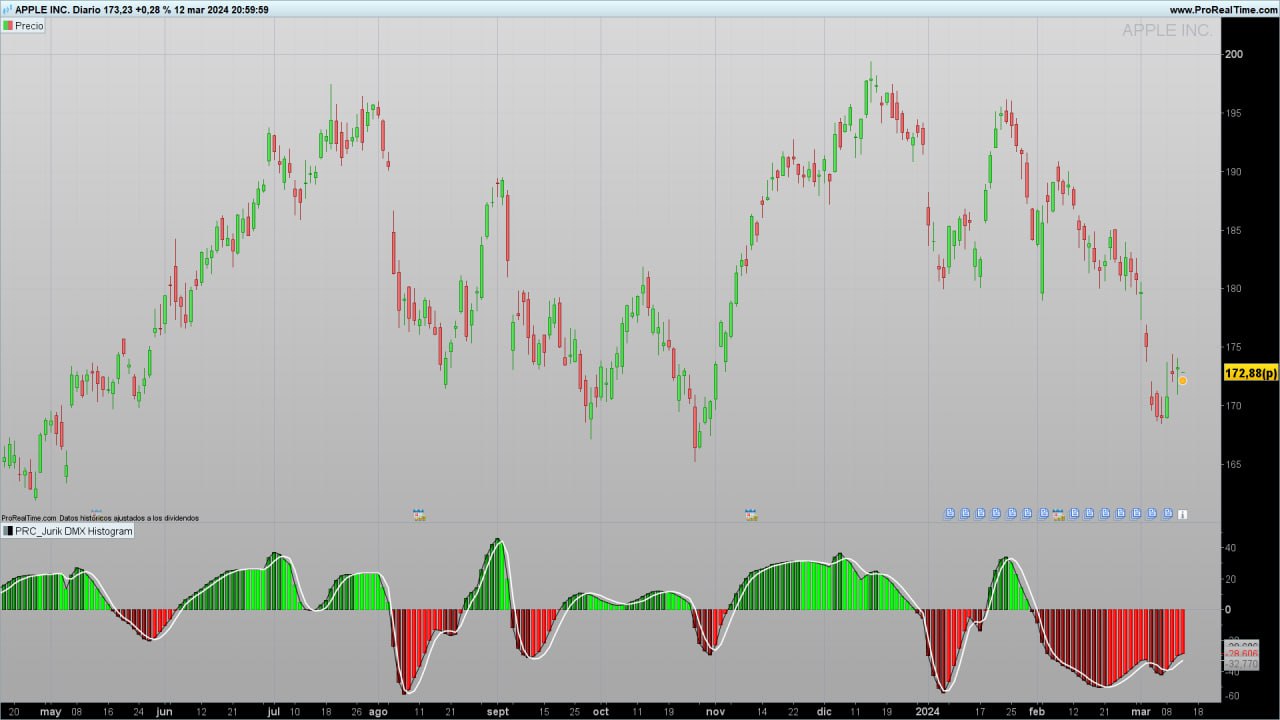
The Jurik DMX indicator is an advanced tool used in technical analysis to measure the direction of market movement and the strength of a trend. Based on Jurik technology, developed by Jurik Research, known for its ability to reduce noise in market data, the Jurik DMX offers smoother and more accurate signals compared to other traditional indicators like the ADX (Average Directional Index). This article will explore how the Jurik DMX works, how to configure it, and how to interpret its signals within the context of the ProRealTime platform.
Fundamentals of the Jurik DMX Indicator
The Jurik DMX is an advanced version of the directional movement indicator (DMX), utilizing Jurik smoothing technology to provide a more accurate and less noisy measure of the direction and strength of a trend in financial markets. While the traditional ADX indicator can be prone to generating false signals due to market volatility, the Jurik DMX smooths out these fluctuations, allowing traders to more clearly identify true trends.
Jurik technology is especially valued for its ability to minimize signal lag while maintaining a high degree of responsiveness to market changes. This is achieved through advanced mathematical algorithms that dynamically adjust smoothing parameters according to market conditions.
Compared to other directional indicators, the Jurik DMX stands out for:
- Noise Reduction: Jurik technology filters out minor fluctuations that can generate false signals in other indicators.
- More Accurate Signals: By smoothing data without significantly delaying the signal, the Jurik DMX allows for a more precise reading of market conditions.
- Versatility: It is applicable across different markets and timeframes, from intraday to long-term analysis.
These benefits make the Jurik DMX a powerful tool for traders seeking to improve their trend analysis and reduce the likelihood of making decisions based on erroneous signals.
Calculation and Logic of the Indicator
The Jurik DMX is an indicator that combines several advanced mathematical components to offer a precise measure of the market’s directional movement. Below is an explanation of the logic behind its calculation and the role of the main variables used in its code.
Main Variables and Parameters
- siglen: Signal smoothing length, controls the level of smoothing applied to the signal generated by the indicator.
- phs (Phase): Jurik phase adjustment, allows the signal to be shifted forward or backward without altering its smoothing.
- len: Length used to calculate the indicator, affects the sensitivity of the Jurik DMX to market movements.
- avglen: Average length used for calculating smoothed volume, a key component in normalizing directional movement data.
Jurik DMX Calculation Workflow
-
Calculation of PlusDM and MinusDM:
- The code first determines the positive (PlusDM) and negative (MinusDM) directions based on the price movements between the current and previous bars.
- These directional measures are used to identify the strength of upward and downward movements in the market.
-
Calculation of TRUR (True Range Unsmoothed):
- TRUR is calculated using a smoothed average of the market’s true ranges.
- Jurik smoothing is applied to dynamically adjust for volatility, allowing the indicator to better respond to changing market conditions.
-
Smoothing of PlusDM and MinusDM with Jurik:
- The code applies Jurik smoothing technology to both PlusDM and MinusDM, resulting in two smoothed values that more accurately reflect the market’s directional strength.
- These values are normalized by dividing by TRUR.
-
Calculation of the Trigger Signal:
- The difference between the smoothed PlusDM and MinusDM is used to generate the trigger signal, which indicates the market’s prevailing direction.
-
Signal Generation:
- The final signal is smoothed again using Jurik technology, ensuring it is as accurate as possible with minimal lag.
- This signal can be compared with the trigger signal to identify buying or selling opportunities.
This focus on advanced smoothing allows the Jurik DMX to provide clear and reliable signals, reducing the influence of minor fluctuations and helping traders identify the real trends in the market.
Indicator Configuration
The configuration of the Jurik DMX indicator is crucial for adapting it to different market conditions and trading styles. Below are the main parameters that can be adjusted, along with recommendations on how to optimize them for the best results.
Configurable Parameters
-
siglen (Signal Smoothing Length):
- Description: This parameter controls the amount of smoothing applied to the signal generated by the indicator. A shorter length will make the indicator more sensitive to market movements, while a longer length will smooth the signal more, reducing noise.
- Default Value: 5
- Recommendation: Use a lower value in volatile markets or for intraday trading where capturing quick movements is necessary. A higher value is preferable on longer-term charts where the goal is to capture broader trends.
-
phs (Phase):
- Description: Phase adjustment allows the signal to be shifted forward or backward without affecting the smoothing. This is useful for better aligning the indicator’s signals with market trends.
- Default Value: 0
- Recommendation: Keep the value at 0 for most cases. Adjust to negative values to anticipate signals or positive values to confirm them in more volatile markets.
-
len (Indicator Length):
- Description: This parameter determines the period used to calculate the Jurik DMX indicator. A longer length makes the indicator less sensitive to daily fluctuations, while a shorter length makes it more reactive.
- Default Value: 32
- Recommendation: For long-term trading, use a higher value to capture more sustained trends. In shorter timeframes, a lower value will allow you to react more quickly to market changes.
-
avglen (Average Length):
- Description: Controls the length used to calculate smoothed volume, which is crucial for normalizing PlusDM and MinusDM data.
- Default Value: 65
- Recommendation: This parameter is key to adjusting how the indicator responds to market volatility. A higher value will smooth out volume fluctuations more, while a lower value will make the indicator respond more quickly to sudden changes in volume.
With the proper configuration, the Jurik DMX indicator becomes a versatile tool that can adapt to various trading strategies, offering clear and reliable signals across a wide range of market conditions.
Signal Interpretation
The Jurik DMX is a powerful indicator that can offer clear signals about the direction and strength of a trend. However, it is important to understand how to interpret these signals correctly to maximize their effectiveness in trading. Below are the main signals generated by the Jurik DMX and how to use them in the context of technical analysis.
Buy and Sell Signals
-
Buy Signal:
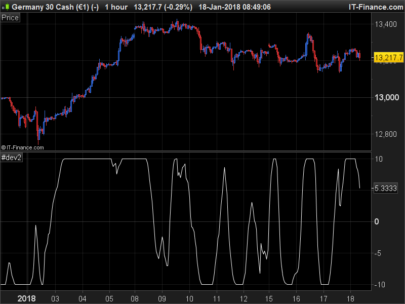
- Condition: The “Histo DMX” (DMX histogram) crosses above the “Signal” line.
- Interpretation: When the DMX histogram crosses above the signal line, it indicates that the market’s directional strength is increasing in an uptrend. This is a signal to consider taking a long position.
- Additional Confirmation: It is recommended to confirm this signal with other indicators, such as a moving average crossover or an oscillator like the RSI, to increase the reliability of the signal.
-
Sell Signal:
- Condition: The “Histo DMX” crosses below the “Signal” line.
- Interpretation: A crossover of the histogram below the signal line indicates that the market’s directional strength is weakening, suggesting a potential reversal towards a downtrend. This is a signal to consider selling or exiting a long position.
- Additional Confirmation: As with buy signals, it is useful to use other indicators or price action analysis to confirm the signal before taking action.
Divergence Signals
-
Bullish Divergence:
- Condition: The price reaches new lows while the “Histo DMX” forms higher lows.
- Interpretation: This divergence indicates that although the price is falling, the strength of the downtrend is diminishing, which could precede a bullish reversal.
-
Bearish Divergence:
- Condition: The price reaches new highs while the “Histo DMX” forms lower highs.
- Interpretation: Here, despite the price continuing to rise, the strength of the uptrend is diminishing, which could indicate an upcoming bearish reversal.
Combining with Other Indicators
The Jurik DMX can be even more powerful when combined with other technical indicators. Common approaches include:
- Moving Averages: Using moving average crossovers alongside the Jurik DMX can help confirm trend direction.
- Volume Indicators: Volume is an important component in validating Jurik DMX signals. An increase in volume along with a DMX signal generally indicates a stronger signal.
- Oscillators: Indicators like RSI or MACD can provide additional confirmation when they align with Jurik DMX signals.
Conclusion
The Jurik DMX is an advanced indicator that can provide a significant advantage in technical analysis due to its ability to smooth market data and reduce noise. Unlike other traditional directional indicators, the Jurik DMX uses advanced smoothing technology to offer more accurate and reliable signals, helping traders identify true trends and minimize the risk of false signals.
Proper configuration of the Jurik DMX is crucial for adapting it to different market conditions, whether used for intraday or long-term trading. Additionally, the correct interpretation of its signals, especially when combined with other indicators, can significantly enhance the accuracy and effectiveness of a trading strategy.
By implementing the Jurik DMX in ProRealTime, traders can benefit from a powerful tool that allows them to make informed and potentially more profitable decisions. With the flexibility to adapt to various strategies, this indicator is a valuable addition for any serious trader looking to improve their technical analysis.
Jurik DMX Indicator Code
Below is the complete code for the Jurik DMX indicator in ProBuilder. You can copy and paste this code directly into the ProRealTime platform and adjust the parameters as needed.
|
1 2 3 4 5 6 7 8 9 10 11 12 13 14 15 16 17 18 19 20 21 22 23 24 25 26 27 28 29 30 31 32 33 34 35 36 37 38 39 40 41 42 43 44 45 46 47 48 49 50 51 52 53 54 55 56 57 58 59 60 61 62 63 64 65 66 67 68 69 70 71 72 73 74 75 76 77 78 79 80 81 82 83 84 85 86 87 88 89 90 91 92 93 94 95 96 97 98 99 100 101 102 103 104 105 106 107 108 109 110 111 112 113 114 115 116 117 118 119 120 121 122 123 124 125 126 127 128 129 130 131 132 133 134 135 136 137 138 139 140 141 142 143 144 145 146 147 148 149 150 151 152 153 154 155 156 157 158 159 160 161 162 163 164 165 166 167 168 169 170 171 172 173 174 175 176 177 178 179 180 181 182 183 184 185 186 187 188 189 190 191 192 193 194 195 196 197 198 199 200 201 202 203 204 205 206 207 208 209 210 211 212 213 214 215 216 217 218 219 220 221 222 223 224 225 226 227 228 229 230 231 232 233 234 235 236 237 238 239 240 241 242 243 244 245 246 247 248 249 250 251 252 253 254 255 256 257 258 259 260 261 262 263 264 265 266 267 268 269 270 271 272 273 274 275 276 277 278 279 280 281 282 283 284 285 286 287 288 289 290 291 292 293 294 295 296 297 298 299 300 301 302 303 304 305 306 307 308 309 310 311 312 313 314 315 316 317 318 319 320 321 322 323 324 325 326 327 328 329 330 331 332 333 334 335 336 337 338 339 340 341 342 343 344 345 346 347 348 349 350 351 352 353 354 355 356 357 358 359 360 361 362 363 364 365 366 367 368 369 370 371 372 373 374 375 376 377 378 379 380 381 382 383 384 385 386 |
//PRC_Jurik DMX Histogram //version = 0 //13.03.24 //Iván González @ www.prorealcode.com //Sharing ProRealTime knowledge ///////////////////////////////////////////////////////////////////// ///inputs//////////////////////////////////// siglen = 5 // Signal Smoothing length phs = 0 //Jurik Phase len = 32 //Length //////////////////////////////////////////// len = MAX(len, 1) len1 = max(log(sqrt(0.5*(len-1)))/log(2)+2,0) Pow1 = max(len1-2,0.5) avglen = 65 //////PlusDM and MinusDM//////////////////// if barindex=0 then up = high down = high else up = high-high[1] down = -(low-low[1]) endif if up > down and up > 0 then plusDM = up else plusDM = 0 endif if down > up and down > 0 then minusDM = down else minusDM = 0 endif //////////////////////////////// //TRUR - JURIK AVERAGE IF BarIndex < avglen+1 THEN Filt0tr = tr Filt1tr = tr trur = tr bsmaxtr = 0 bsmintr = 0 vsumtr = 0 avoltytr = 0 ELSE del1tr = tr-bsmaxtr[1] del2tr = tr-bsmintr[1] div = 1/(10+10*(min(max(len-10,0),100))/100) if abs(del1tr)>abs(del2tr) then voltytr = abs(del1tr) else voltytr = abs(del2tr) endif vsumtr = vsumtr[1]+div*(voltytr-voltytr[10]) tempavgtr = average[avglen](vsumtr) y= barindex+1 if (y <= avglen+1) then avoltytr = avoltytr[1]+2*(vsumtr-avoltytr[1])/(avglen+1) else avoltytr = tempavgtr endif if avoltytr > 0 then dvoltytr = voltytr/avoltytr else dvoltytr = 0 endif if dvoltytr > pow(len1,1/pow1) then dvoltytr = pow(len1,1/pow1) else dvoltytr = dvoltytr endif if dvoltytr < 1 then dvoltytr= 1 else dvoltytr = dvoltytr endif pow2tr = pow(dvoltytr,pow1) len2 = sqrt(0.5*(len-1))*len1 kvtr = pow(len2/(len2+1),sqrt(pow2tr)) if del1tr > 0 then bsmaxtr = tr else bsmaxtr = tr - kvtr*del1tr endif if del2tr < 0 then bsmintr = tr else bsmintr = tr - kvtr*del2tr endif if phs < -100 then phaseratio = 0.5 elsif phs > 100 then phaseratio = 2.5 else phaseratio =phs/100+1.5 endif beta = 0.45 * (len - 1) / (0.45 * (len - 1) + 2) alphatr = pow(beta,pow2tr) Filt0tr = (1 - alphatr) * tr + alphatr * Filt0tr[1] Det0tr = (tr - Filt0tr[0]) * (1 - beta) + beta * Det0tr[1] Filt1tr = Filt0tr[0] + phaseratio * Det0tr[0] Det1tr = (Filt1tr[0] - trur[1]) * ((1 - alphatr) * (1 - alphatr)) + (alphatr * alphatr) * Det1tr[1] trur = trur[1] + Det1tr[0] ENDIF /////Plus IF BarIndex < avglen+1 THEN Filt0pl = 0 Filt1pl = 0 jurikPlus = 0 bsmaxpl = 0 bsminpl = 0 vsumpl = 0 avoltypl = 0 ELSE del1pl = plusDM-bsmaxpl[1] del2pl = plusDM-bsminpl[1] div = 1/(10+10*(min(max(len-10,0),100))/100) if abs(del1pl)>abs(del2pl) then voltypl = abs(del1pl) else voltypl = abs(del2pl) endif vsumpl = vsumpl[1]+div*(voltypl-voltypl[10]) tempavgpl = average[avglen](vsumpl) y= barindex+1 if (y <= avglen+1) then avoltypl = avoltypl[1]+2*(vsumpl-avoltypl[1])/(avglen+1) else avoltypl = tempavgpl endif if avoltypl > 0 then dvoltypl = voltypl/avoltypl else dvoltypl = 0 endif if dvoltypl > pow(len1,1/pow1) then dvoltypl = pow(len1,1/pow1) else dvoltypl = dvoltypl endif if dvoltypl < 1 then dvoltypl= 1 else dvoltypl = dvoltypl endif pow2pl = pow(dvoltypl,pow1) len2 = sqrt(0.5*(len-1))*len1 kvpl = pow(len2/(len2+1),sqrt(pow2pl)) if del1pl > 0 then bsmaxpl = plusDM else bsmaxpl = plusDM - kvpl*del1pl endif if del2pl < 0 then bsminpl = plusDM else bsminpl = plusDM - kvpl*del2pl endif if phs < -100 then phaseratio = 0.5 elsif phs > 100 then phaseratio = 2.5 else phaseratio =phs/100+1.5 endif beta = 0.45 * (len - 1) / (0.45 * (len - 1) + 2) alphapl = pow(beta,pow2pl) Filt0pl = (1 - alphapl) * plusDM + alphapl * Filt0pl[1] Det0pl = (plusDM - Filt0pl[0]) * (1 - beta) + beta * Det0pl[1] Filt1pl = Filt0pl[0] + phaseratio * Det0pl[0] Det1pl = (Filt1pl[0] - jurikPlus[1]) * ((1 - alphapl) * (1 - alphapl)) + (alphapl * alphapl) * Det1pl[1] jurikPlus = jurikPlus[1] + Det1pl[0] ENDIF plus = (100*jurikPlus/trur) /////////////////////////////////////////////// /////minus IF BarIndex < avglen+1 THEN Filt0mn = 0 Filt1mn = 0 jurikMinus = 0 bsmaxmn = 0 bsminmn = 0 vsummn = 0 avoltymn = 0 ELSE del1mn = minusDM-bsmaxmn[1] del2mn = minusDM-bsminmn[1] div = 1/(10+10*(min(max(len-10,0),100))/100) if abs(del1mn)>abs(del2mn) then voltymn = abs(del1mn) else voltymn = abs(del2mn) endif vsummn = vsummn[1]+div*(voltymn-voltymn[10]) tempavgmn = average[avglen](vsummn) y= barindex+1 if (y <= avglen+1) then avoltymn = avoltymn[1]+2*(vsummn-avoltymn[1])/(avglen+1) else avoltymn = tempavgmn endif if avoltymn > 0 then dvoltymn = voltymn/avoltymn else dvoltymn = 0 endif if dvoltymn > pow(len1,1/pow1) then dvoltymn = pow(len1,1/pow1) else dvoltymn = dvoltymn endif if dvoltymn < 1 then dvoltymn= 1 else dvoltymn = dvoltymn endif pow2mn = pow(dvoltymn,pow1) len2 = sqrt(0.5*(len-1))*len1 kvmn = pow(len2/(len2+1),sqrt(pow2mn)) if del1mn > 0 then bsmaxmn = minusDM else bsmaxmn = minusDM - kvmn*del1mn endif if del2mn < 0 then bsminmn = minusDM else bsminmn = minusDM - kvmn*del2mn endif if phs < -100 then phaseratio = 0.5 elsif phs > 100 then phaseratio = 2.5 else phaseratio =phs/100+1.5 endif beta = 0.45 * (len - 1) / (0.45 * (len - 1) + 2) alphamn = pow(beta,pow2mn) Filt0mn = (1 - alphamn) * minusDM + alphamn * Filt0mn[1] Det0mn = (minusDM - Filt0mn[0]) * (1 - beta) + beta * Det0mn[1] Filt1mn = Filt0mn[0] + phaseratio * Det0mn[0] Det1mn = (Filt1mn[0] - jurikMinus[1]) * ((1 - alphamn) * (1 - alphamn)) + (alphamn * alphamn) * Det1mn[1] jurikMinus = jurikMinus[1] + Det1mn[0] ENDIF minus = 100*jurikMinus/trur ///////////////////////////////////////////////////////////// ////////Trigger trigger = plus-minus /////////////////////////////////////////////////////////// ///////signal siglen = MAX(siglen, 1) len1 = max(log(sqrt(0.5*(siglen-1)))/log(2)+2,0) Pow1 = max(len1-2,0.5) avglen = 65 IF BarIndex < avglen+1 THEN Filt0 = 0 Filt1 = 0 signal = 0 bsmax = 0 bsmin = 0 vsum = 0 avolty = 0 ELSE del1 = trigger-bsmax[1] del2 = trigger-bsmin[1] div = 1/(10+10*(min(max(siglen-10,0),100))/100) if abs(del1)>abs(del2) then volty = abs(del1) else volty = abs(del2) endif vsum = vsum[1]+div*(volty-volty[10]) tempavg = average[avglen](vsum) y= barindex+1 if (y <= avglen+1) then avolty = avolty[1]+2*(vsum-avolty[1])/(avglen+1) else avolty = tempavg endif if avolty > 0 then dvolty = volty/avolty else dvolty = 0 endif if dvolty > pow(len1,1/pow1) then dvolty = pow(len1,1/pow1) else dvolty = dvolty endif if dvolty < 1 then dvolty= 1 else dvolty = dvolty endif pow2 = pow(dvolty,pow1) len2 = sqrt(0.5*(siglen-1))*len1 kv = pow(len2/(len2+1),sqrt(pow2)) if del1 > 0 then bsmax = trigger else bsmax = trigger - kv*del1 endif if del2 < 0 then bsmin = trigger else bsmin = trigger - kv*del2 endif if phs < -100 then phaseratio = 0.5 elsif phs > 100 then phaseratio = 2.5 else phaseratio =phs/100+1.5 endif beta = 0.45 * (siglen - 1) / (0.45 * (siglen - 1) + 2) alpha = pow(beta,pow2) Filt0 = (1 - alpha) * trigger + alpha * Filt0[1] Det0 = (trigger - Filt0[0]) * (1 - beta) + beta * Det0[1] Filt1 = Filt0[0] + phaseratio * Det0[0] Det1 = (Filt1[0] - signal[1]) * ((1 - alpha) * (1 - alpha)) + (alpha * alpha) * Det1[1] signal = signal[1] + Det1[0] ENDIF ///////////////////////////////////////////////////// /////color if trigger >=0 and trigger>=signal then r=0 g=120 elsif trigger >=0 and trigger<signal then r=0 g=255 elsif trigger <0 and trigger<signal then r=120 g=0 else r=255 g=0 endif return trigger as "Histo DMX"coloured(r,g,0)style(histogram),trigger as "DMX" style(line), signal as "Signal"coloured("white")style(line,2) |
Share this
No information on this site is investment advice or a solicitation to buy or sell any financial instrument. Past performance is not indicative of future results. Trading may expose you to risk of loss greater than your deposits and is only suitable for experienced investors who have sufficient financial means to bear such risk.
ProRealTime ITF files and other attachments :
Find other exclusive trading pro-tools on ![]()
PRC is also on YouTube, subscribe to our channel for exclusive content and tutorials


très bel indicateur merci