
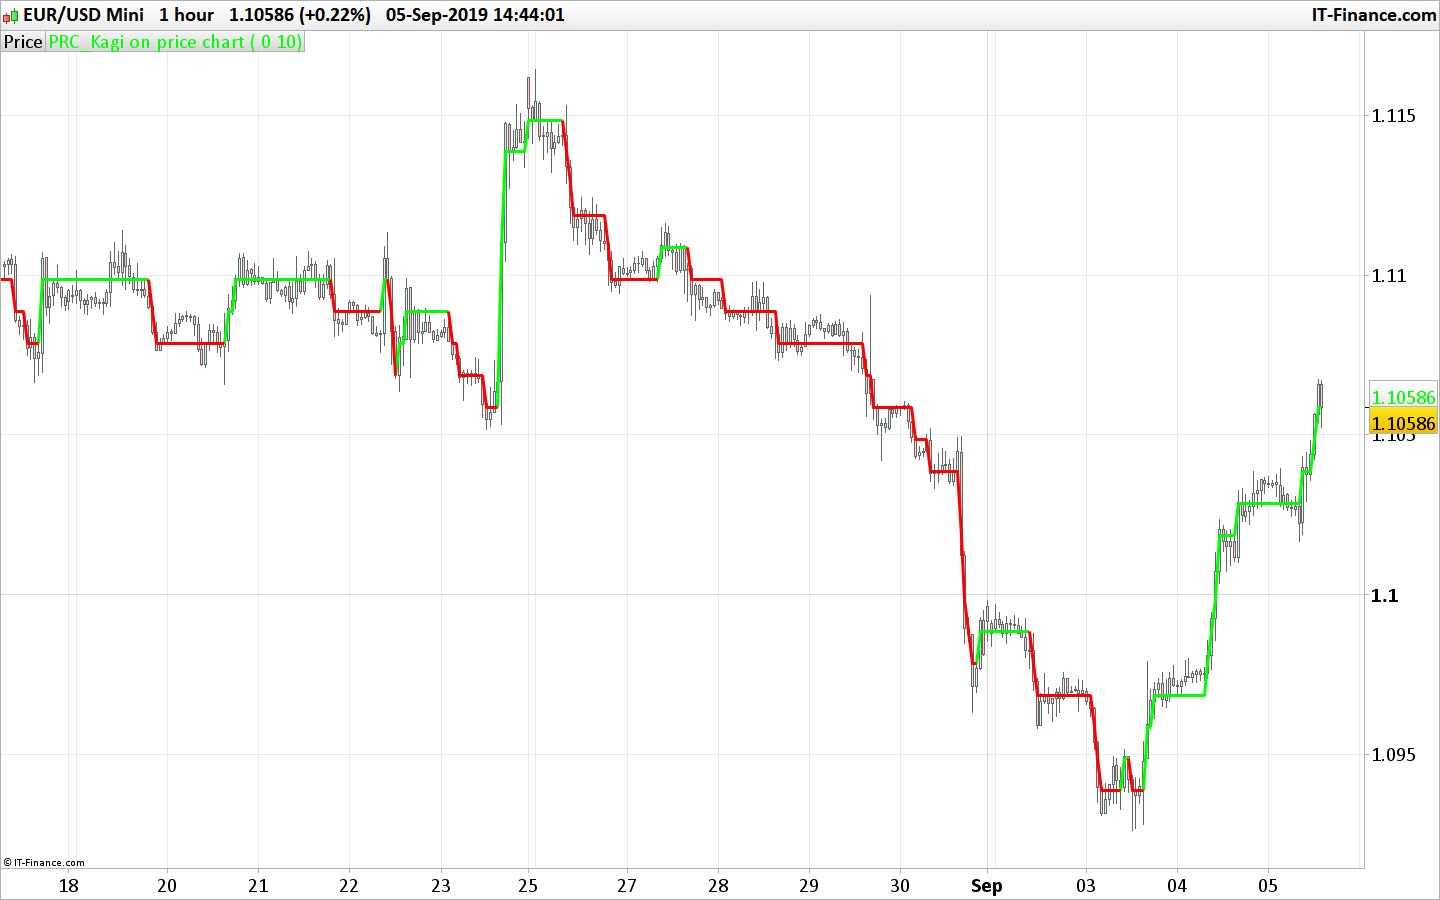
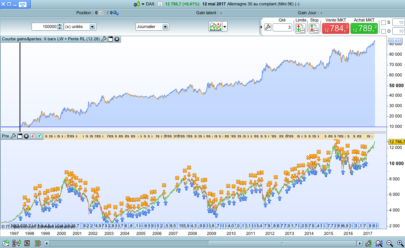
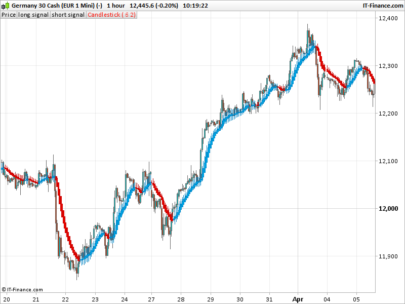
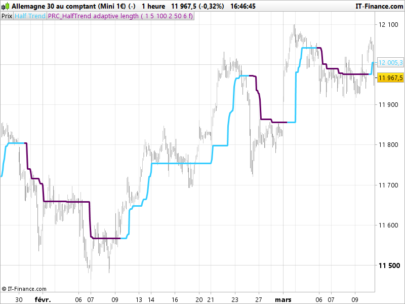
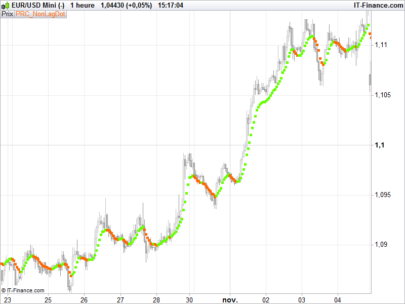
Kagi is a type of graphic representation that comes from Asia. This type of price chart is distinguished by the fact that one draws a Kagi type graph taking into account only the price. Indeed, even if time is represented on the abscissa axis, the time scale is not linear. This type of chart is convenient to follow the trend.
The horizontal lines have no real meaning, their role is to give continuity to the price. These horizontal lines are called inflection lines.
Two variables stand out with the Kagi, the color and the sense of the lines. These two variables depend on the direction of the market:
- The line is again in the same direction and the same color as the previous line when prices go in the same direction.
- The color remains the same, but the direction of the line is opposite when the prices exert a reversal of a fixed amount in advance (we speak of threshold of reversal).
- The color and the direction of the line change when there is a break of a lower or higher observed in the past.
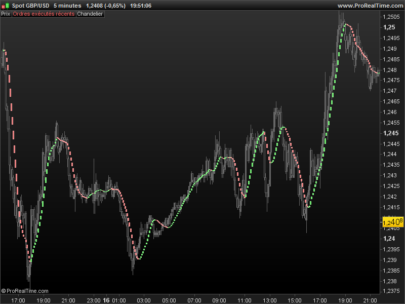
There are two methods of using Kagi:
- We buy when there is a turnaround and sell when there is a downturn. In other words, color changes are buying and selling signals.
- We expect confirmation of two or three breaks higher or lower after a change of color to switch to the long or short order.
In this indicator you can choose which type of reversal you want: a percentage amount of price , or a fix points/pips amount. Set one of the reversal setting to 0 will deactivate it to use the other one.
|
1 2 3 4 5 6 7 8 9 10 11 12 13 14 15 16 17 18 19 20 21 22 23 24 25 26 27 28 29 30 31 32 33 34 35 36 37 38 39 40 41 42 43 44 45 46 47 48 49 50 51 52 53 54 55 56 57 58 59 60 61 |
//PRC_Kagi on price chart | indicator //05.09.2019 //Nicolas @ www.prorealcode.com //Sharing ProRealTime knowledge // --- settings // select one of the two possible setting (0=don't use) ReversalAmountPercent = 1.5 //amount of price percent to inverse Kagi trend ReversalAmountPoints = 0 //amount of points to inverse Kagi trend // --- end of settings once kagi=close if ReversalAmountPercent>0 then //percent retracement pup = (close-kagi)/kagi pdn = (kagi-close)/kagi InvDec = 1/0.1 //bullish reversal if pup>=ReversalAmountPercent/100 then coeff = abs(pup/ReversalAmountPercent)*100 coeff = round(InvDec*coeff-0.5)/InvDec kagi=kagi+(kagi*(ReversalAmountPercent/100)*coeff) r=0 g=255 endif //bearish reversal if pdn>=ReversalAmountPercent/100 then coeff = abs(pdn/ReversalAmountPercent)*100 coeff = round(InvDec*coeff-0.5)/InvDec kagi=kagi-(kagi*(ReversalAmountPercent/100)*coeff) r=255 g=0 endif endif if ReversalAmountPoints>0 then //points retracement pup = close-kagi pdn = kagi-close InvDec = 1 //bullish reversal if pup>=ReversalAmountPoints*pointsize then coeff = (pup/pointsize)/ReversalAmountPoints coeff = round(InvDec*coeff-0.5)/InvDec kagi=kagi+(ReversalAmountPoints*pointsize)*coeff r=0 g=255 endif //bearish reversal if pdn>=ReversalAmountPoints*pointsize then coeff = (pdn/pointsize)/ReversalAmountPoints coeff = round(InvDec*coeff-0.5)/InvDec kagi=kagi-(ReversalAmountPoints*pointsize)*coeff r=255 g=0 endif endif RETURN Kagi coloured(r,g,0) style(line,3) |
Share this
No information on this site is investment advice or a solicitation to buy or sell any financial instrument. Past performance is not indicative of future results. Trading may expose you to risk of loss greater than your deposits and is only suitable for experienced investors who have sufficient financial means to bear such risk.
ProRealTime ITF files and other attachments :
Find other exclusive trading pro-tools on ![]()
PRC is also on YouTube, subscribe to our channel for exclusive content and tutorials


hi nicolas.. how ru.. can u help me code ross hook for tradingview#
Hi, we do not offer free assistance for tradingview programming. You can send us a query to the programming services: https://www.prorealcode.com/trading-programming-services/
Hola has un indicador donde trase una linea de tendencia con uniendo los maximos de un mes y otro con los minimos de un 1 mes y tambien que se por barras o velas
Por favor haga preguntas en nuestros foros. Abra un tema individual para cada una de sus solicitudes.
“There are two methods of using Kagi:
We buy when there is a turnaround and sell when there is a downturn. In other words, color changes are buying and selling signals.”
I will give it a try to develop a trading strategy based upon the advice above for buying and selling, I do this for the DAX index, and I will use 5 minutes, and with confirmation of the higher MTF of 10 minutes,
For example coded as Buying when the Kagi in 5 min MTF is minimal equal to the previous bar (turning point) and the Kagi in the 10 min MTF is minimal equal to the previous 10 min bar and smaller then the 5 min Kagi (confirmation), with opening only in morning hours. See if that will deliver profitable trades.
Or the other way around, for example coded as Buying when the Kagi in 10 min MTF is minimal equal to the previous bar (turning point) and the Kagi in the 5 min MTF is minimal equal to the previous 5 min bar and the 5 min Kagi > 10 min Kagi (confirmation), with opening only in morning hours. See if that will deliver profitable trades.
Thanks, let us know how it is going?
Hallo Nicolas,
I have tested the pre-mentioned concept, and had to change the concept :
1. buy when Kagi is greater then the previous Kagi AND ( for a higher timeframe Kagi is greater then previous Kagi or Kagi is equal to previous Kagi ). Vice versa for selling. I used time frames of 3 minutes and 6 minutes and 2 minutes and 4 minutes
2. buying between 8 and 15 hr CET, no more then 2 opening transactions per day, regardless in the market with a position or not
3. add a trailing stop, which is the exit strategy and a stop-loss to protect significant losses.
4. I varied with the ReversalAmountPercent and the trailing stop, the smaller timeframes, the greater the reversal% seems to be for best results.
Good and relative steady profits seems to appear for the indices, it seems not to work with currencies.
Disadvantages of the strategy is that the trades are for a long time in the market (interest costs for ETFs) and only a few trades are generated ( +/- 40 in a year) , which reduces reliability significantly.
But overall promising !
Kind regards, Jan
Bonjour Nicolas
j’ai chargé le fichier ITF mais il ne semble pas fonctionner : il crée un indicateur grisé sous le graphique avec une ligne au milieu, mais pas de tracé sur le graphique lui même. J’utilise la dernière version de PRT : peut-être n’est il pas adapté pour cette version ? Si c’est le cas, existe-t-il une version actualisée ? Avec mes remerciements
il faut le placer sur le prix
Merci pour la réponse Nicolas. C’est bien ce que j’ai fait mais ça ne fonctionne toujours pas. J’ai mis 1.5 comme valeur sur la ligne 38 et 0 sur la ligne 15 pour prioriser les points et essayé sur UT 2mn et 15mn. Peut être le problème vient il de là où de l’UT choisie ? J’ai dernier version de PRT
Veramente ottimo, era quello che cercavo, si potrebbe modificare inserendo come variazione atr? Grazie
Perché no, chiedetelo con una descrizione dettagliata nel forum degli indicatori, per favore!