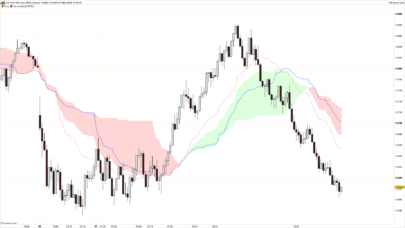
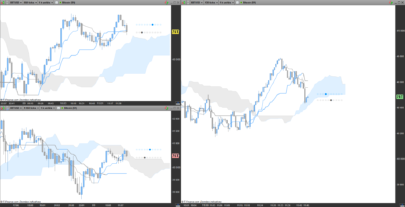
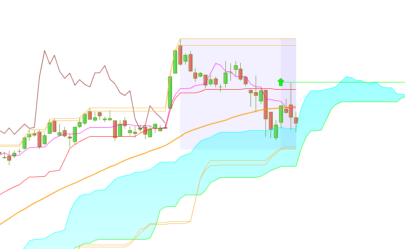
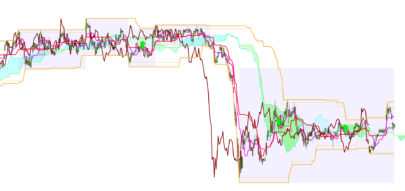
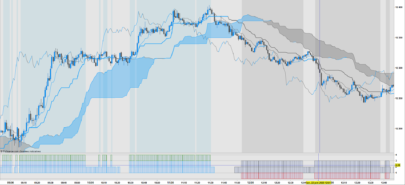
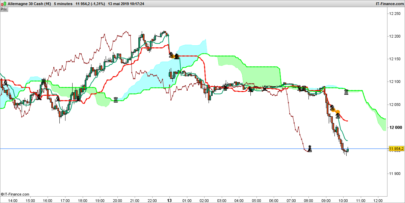
In my pursuit to quantify the Ichimoku indicator, I have tried to quantify implied volatility by measuring the Kumo thickness. Firstly, I took the absolute value of the distance between SpanA and SpanB, I then normalized the value and created standard deviation bands. Now I can compare the Kumo thickness with the average thickness over 200 periods. When the value goes above 100, it implies that the Kumo is thicker than 2 standard deviations of the average (there is therefore only a 5% chance that this happens). A reading over 100 might indicate trend exhaustion and a reading below 20 indicates low volatility and Kumo twists (I chose 20 only by observation and not statistical significance). Interestingly, this indicator sometime gives similar information to ADX.
So far, the best use for this indicator is as a setup indicator for trend exhaustion or low volatility breakouts from Kumo twists. Extreme readings before Kumo breakouts looks interesting.
|
1 2 3 4 5 6 7 8 9 10 11 12 13 14 15 16 17 18 19 20 21 |
//Ichimoku Tenkansen = (highest[9](high)+lowest[9](low))/2 Kijunsen = (highest[26](high)+lowest[26](low))/2 FutureSpanA = (tenkansen+kijunsen)/2 FutureSpanB = (highest[52](high)+lowest[52](low))/2 //Implied volatility based on Kumo thickness Kumodepth = abs(FutureSpanA - FutureSpanB) //Normalize implied volatility Indicator = Kumodepth AverageIndicator = average[200](Indicator) StandardDeviation = STD[200](Indicator) UpperBand = AverageIndicator + (2 * StandardDeviation) LowerBand = AverageIndicator - (2 * StandardDeviation) NormalizedIndicator = ((Indicator - LowerBand) / (UpperBand - LowerBand)) * 100 Overbought = 100 Oversold = 20 Return NormalizedIndicator as "Kumo implied volatility", Overbought as "Overbought", Oversold as "Oversold" |
Share this
No information on this site is investment advice or a solicitation to buy or sell any financial instrument. Past performance is not indicative of future results. Trading may expose you to risk of loss greater than your deposits and is only suitable for experienced investors who have sufficient financial means to bear such risk.
ProRealTime ITF files and other attachments :PRC is also on YouTube, subscribe to our channel for exclusive content and tutorials



Very interesting and clever. Well done. I’m looking further for your next contribution 🙂
Thanks Nicolas 🙂
Thanks. The indicator is great. It has a great potential.
Great job!! I love everything that involve Ichimoku. Did you think about changing the line to calculate the Kumodepth as follow Kumodepth = abs(FutureSpanA – FutureSpanB)
so that reflect the 26-period offset?
Thanx gabri. Yes I did play around with the offset. It works but I like the “earlier” warning before the Kumo break as I do not trade the extreme readings itself.
Hi, Is this code can be used for MT4 ?