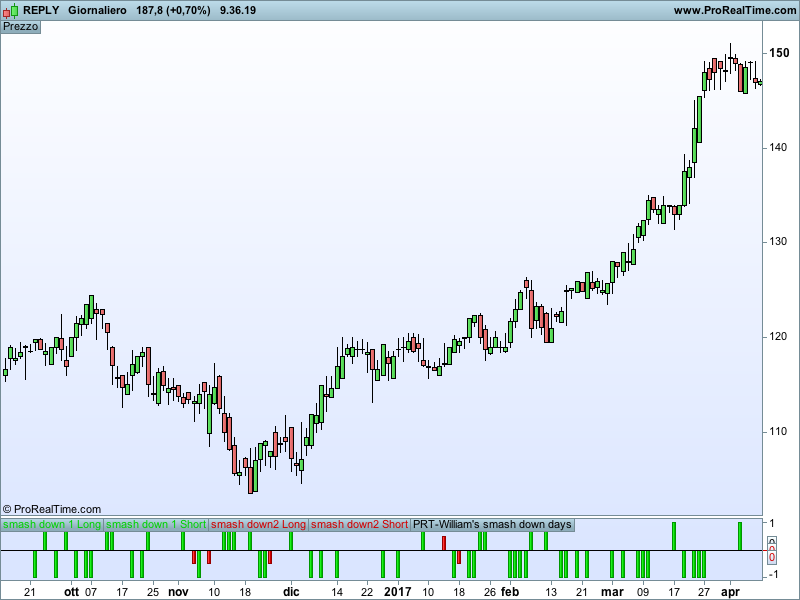
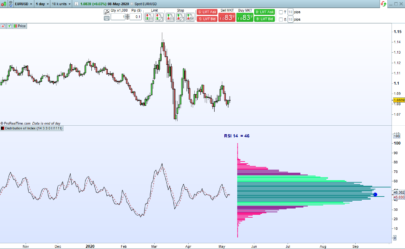
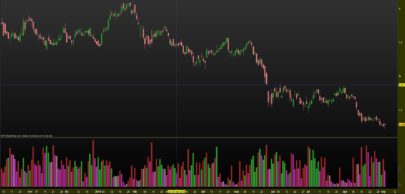
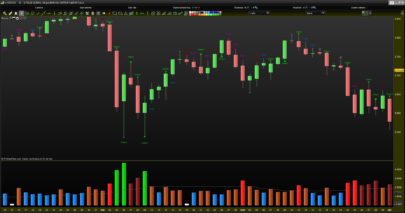
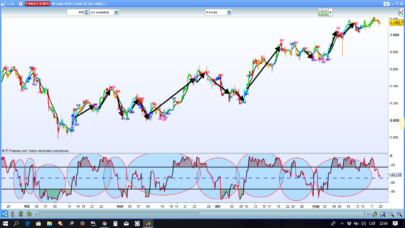
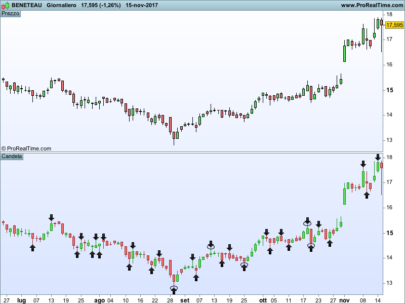
This is a coded version of Larry Williams’ smash down days as described in his book “Long-Term Secrets to Short-Term Trading”.
I put in the same code the two different smash down days entries. When an histogram bar is showed enter long (or short) at the high (or low) of the price bar corresponding to the histogram bar.
Since I don’t do short term trading I haven’t backtested the system but the author promises wonders. I personally keep an eye on this indicator to asses the end of a correction for growth stocks.
Blue skies!!
|
1 2 3 4 5 6 7 8 9 10 11 12 13 14 15 16 17 18 19 20 21 22 23 24 25 26 27 28 29 30 31 32 33 34 35 36 37 38 39 |
//smash day type 1 //long c10=low<lowest[2](low[1]) c11=close<low[1] if c10 and c11 then sdlong=1 else sdlong=0 endif //short c12=high>highest[2](high[1]) c13=close>high[1] if c12 and c13 then sdshort=-1 else sdshort=0 endif //smash down type 2 //long c20=close>close[1] c21=close<open c22=(close-low)<=((0.25*range)) if c20 and c21 and c22 then sd2long=0.5 else sd2long=0 endif //short c23=close<close[1] c24=close>open c25=(high-close)<=((0.25*range)) if c23 and c24 and c25 then sd2short=-0.5 else sd2short=0 endif return sdlong coloured (0,210,0) style(histogram) as "smash down 1 Long",sdshort coloured (0,210,0) style(histogram) as "smash down 1 Short",sd2long coloured (210,0,0) style(histogram) as "smash down2 Long",sd2short coloured (210,0,0) style(histogram) as "smash down2 Short",0 |
Share this
No information on this site is investment advice or a solicitation to buy or sell any financial instrument. Past performance is not indicative of future results. Trading may expose you to risk of loss greater than your deposits and is only suitable for experienced investors who have sufficient financial means to bear such risk.
ProRealTime ITF files and other attachments :PRC is also on YouTube, subscribe to our channel for exclusive content and tutorials

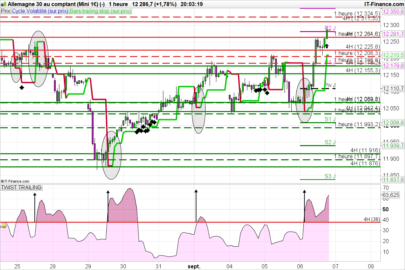
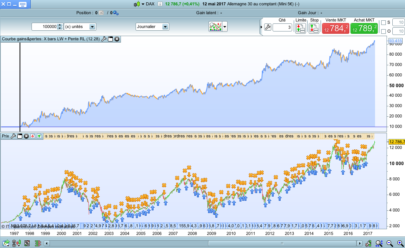
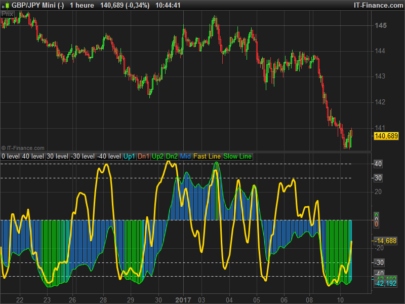
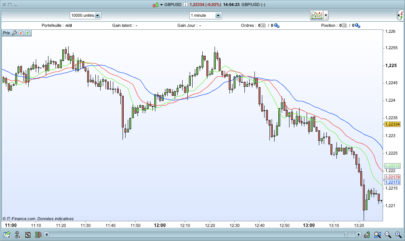
Hi Gabri, can you provide a description of how to use this indicator or perhaps point us to a link on how to read it?
Juanj,
is all in Larry Williams’ book “Long-Term Secrets to Short-Term Trading”. Just to give you a quick and dirty overview (I will cover just the long entry since the short is just the opposite) you need to put a buy stop 1 tick above the bar preceding the one with the long entry signal. The author doesn’t say how long to keep this buy for.
Gabriele
Ciao Gabry,
potresti spiegarmi come funziona questo indicatore precisamente?
Al,
ti faccio un esempio con il long. Quando ti appare una barra “smash 1 long” o “smash 2 long” metti un ordine di buy stop un tick sopra il massimo della giornata che precede la barra di smash. Per il short e’ l’opposto ovviamente.
Gabriele
Ok grazie Gabri
thnx for posting. Combine it with Williams’ 3 bar trailing stop to create strategy!
Paul,
he uses the best day of the week to trade (he figured out the best day to enter, exit and how much holding the stock) but I agree with you that combining the two indicators you can make great things. If I was a short-term trader and I had more abilities to backtest I would try an entry based on the daily smash down days with a 3 bar trailing stop on an intraday graph.
G