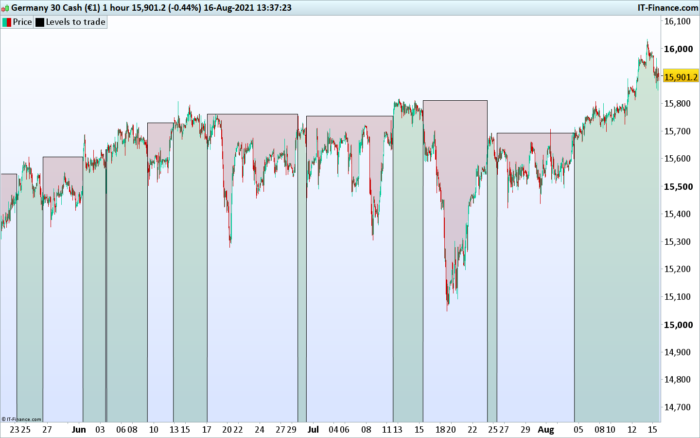
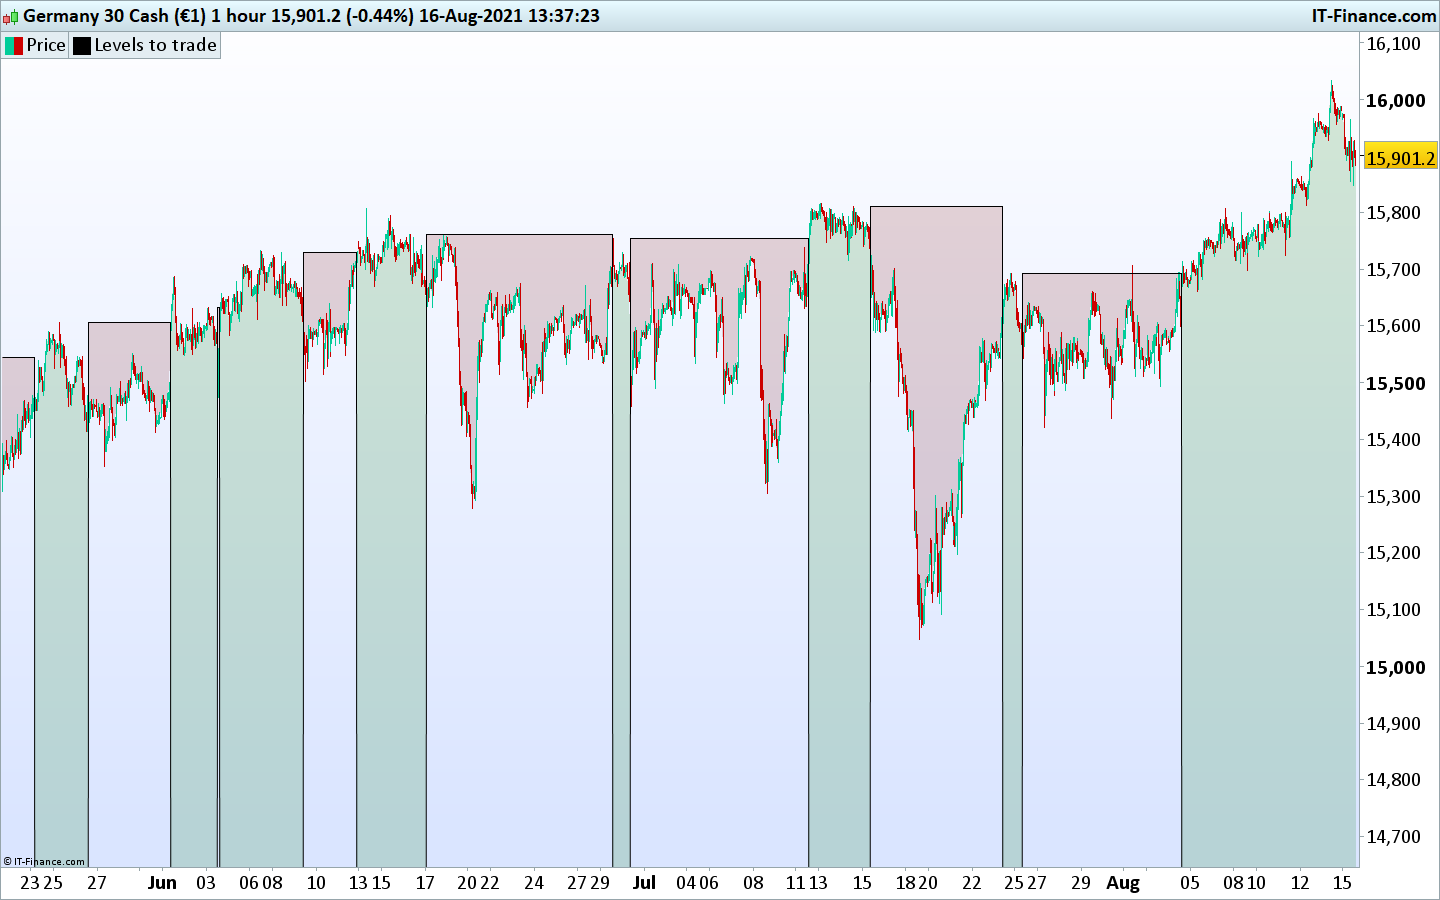
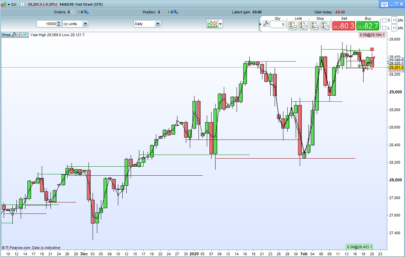
This indicator plots the level of the highest high from the last 33 days after identifying a pullback from uptrend momentum. The indicator can be used to trade either the pullback or the possible breakout. The level is plotted above zero when the pullback happens and goes to zero when the breakout of this level occurs or when price resumes uptrend momentum.
It works like this:
The indicator calculates an average price based on pivot points and moving averages.
Price closes 2 * ATR above the average price. This is the starting level.
Second step is for price to then move another 3* ATR above this starting level. This has to be done without pulling back to the average price. This means we are seeing an upwards move of 5 ATR without any deep pullback.
The third step is for price to return to the average price. Uptrend momentum is no longer present. Market is pulling back. When price returns to the average price the indicator plots a line of the highest high of the last 33 days.
When price takes out that high or when the indicator identifies the start of a new run up (the first and second step taking place again) the line goes to zero.
I have no prior coding-knowledge so the coding will reflect that. I have copy pasted from different indicators, read on prorealcode forum and done some trial and error. Robertogozzi has helped eliminate some problems in the code while I was trying to make a screener from this.
|
1 2 3 4 5 6 7 8 9 10 11 12 13 14 15 16 17 18 19 20 21 22 23 24 25 26 27 28 29 30 31 32 33 34 35 36 37 38 39 40 41 42 43 44 45 46 47 48 49 50 51 52 53 54 55 56 57 58 59 60 61 62 63 64 65 66 67 68 69 70 71 72 73 74 75 76 77 78 79 80 81 82 83 84 85 86 87 88 89 90 91 92 93 94 95 96 97 98 99 100 101 102 103 104 105 |
//Pivot calculation method IF BarIndex = 0 THEN mode = 1 dailypivot = 1 lastWeekbarIndex = 1 weeklyhigh = undefined weeklylow = undefined weeklypivot = undefined lastmonthbarindex = 1 monthlyhigh = undefined monthlylow = undefined monthlypivot = undefined ENDIF If Day>Day[1] then If mode = 0 then dailyPivot = (DHigh(1) + DLow(1) + Close[1]) / 3 Elsif mode = 1 then dailyPivot = (Open + DHigh(1) + DLow(1) + Close[1]) / 4 Elsif mode = 2 then dailyPivot = (DHigh(1) + DLow(1) + Close[1]*2) / 4 Else dailyPivot = (Open*2 + DHigh(1) + DLow(1)) / 4 Endif Endif If DayOfWeek<DayOfWeek[1] then weeklyHigh = Highest[min(254,max(1,BarIndex - lastweekBarIndex))] weeklyLow = Lowest[min(254,max(1,BarIndex - lastweekBarIndex))] lastWeekBarIndex = BarIndex If mode = 0 then weeklyPivot = (weeklyHigh + weeklyLow + Close[1]) / 3 Elsif mode = 1 then weeklyPivot = (Open + weeklyHigh + weeklyLow + Close[1]) / 4 Elsif mode = 2 then weeklyPivot = (weeklyHigh + weeklyLow + Close[1]*2) / 4 Else weeklyPivot = (Open*2 + weeklyHigh + weeklyLow) / 4 Endif Endif If Month<>Month[1] then monthlyHigh = Highest[min(254,max(1,BarIndex - lastMonthBarIndex))] monthlyLow = Lowest[min(254,max(1,BarIndex - lastMonthBarIndex))] lastMonthBarIndex = BarIndex If mode = 0 then monthlyPivot = (monthlyHigh + monthlyLow + Close[1]) / 3 Elsif mode = 1 then monthlyPivot = (Open + monthlyHigh + monthlyLow + Close[1]) / 4 Elsif mode = 2 then monthlyPivot = (monthlyHigh + monthlyLow + Close[1]*2) / 4 Else monthlyPivot = (Open*2 + monthlyHigh + monthlyLow) / 4 Endif Endif c1= (DailyPivot *2 + weeklyPivot *2 + monthlyPivot *2 + average [5] + average [20] + average [50] + average [100] + average [200]) / 11 C2= close - C1 IF c2 > 2 * Averagetruerange Then RESULT = 10 ELSIF LOW<C1 THEN RESULT = 0 ENDIF IF RESULT[0] > RESULT[1] THEN FINALRESULT = CLOSE [0] ENDIF IF FINALRESULT OR RESULT >0 THEN SIGNAL = 1 ELSIF (LOW<C1) THEN SIGNAL = 0 ENDIF IF SIGNAL > 0 AND HIGH - FINALRESULT > Averagetruerange * 3 THEN FINALSIGNAL = 1 ELSIF (LOW<C1) THEN FINALSIGNAL = 0 ENDIF If FINALSIGNAL > 0 and c2 > 3 * Averagetruerange then finalentrysignal = 1 ELSIF (LOW<C1) THEN finalENTRYSIGNAL = 0 Endif If finalentrysignal<finalentrysignal[1] then level=(highest[33](HIGH[1])) elsif finalentrysignal>finalentrysignal[1] or close>level then level=0 endif return level |
Share this
No information on this site is investment advice or a solicitation to buy or sell any financial instrument. Past performance is not indicative of future results. Trading may expose you to risk of loss greater than your deposits and is only suitable for experienced investors who have sufficient financial means to bear such risk.
ProRealTime ITF files and other attachments :PRC is also on YouTube, subscribe to our channel for exclusive content and tutorials


I have a thread in pro screener support where I describe some problems with the creation of a screener from this indicator. I have received help there but was not able to make it work fully. I have also contacted prorealcode for support but they have not returned with any solution. If you like the indicator maybe you would like to help me with the screener based on it? Here is the thread in pro screener support: https://www.prorealcode.com/topic/from-indicator-to-screener-screener-misses-stocks/