

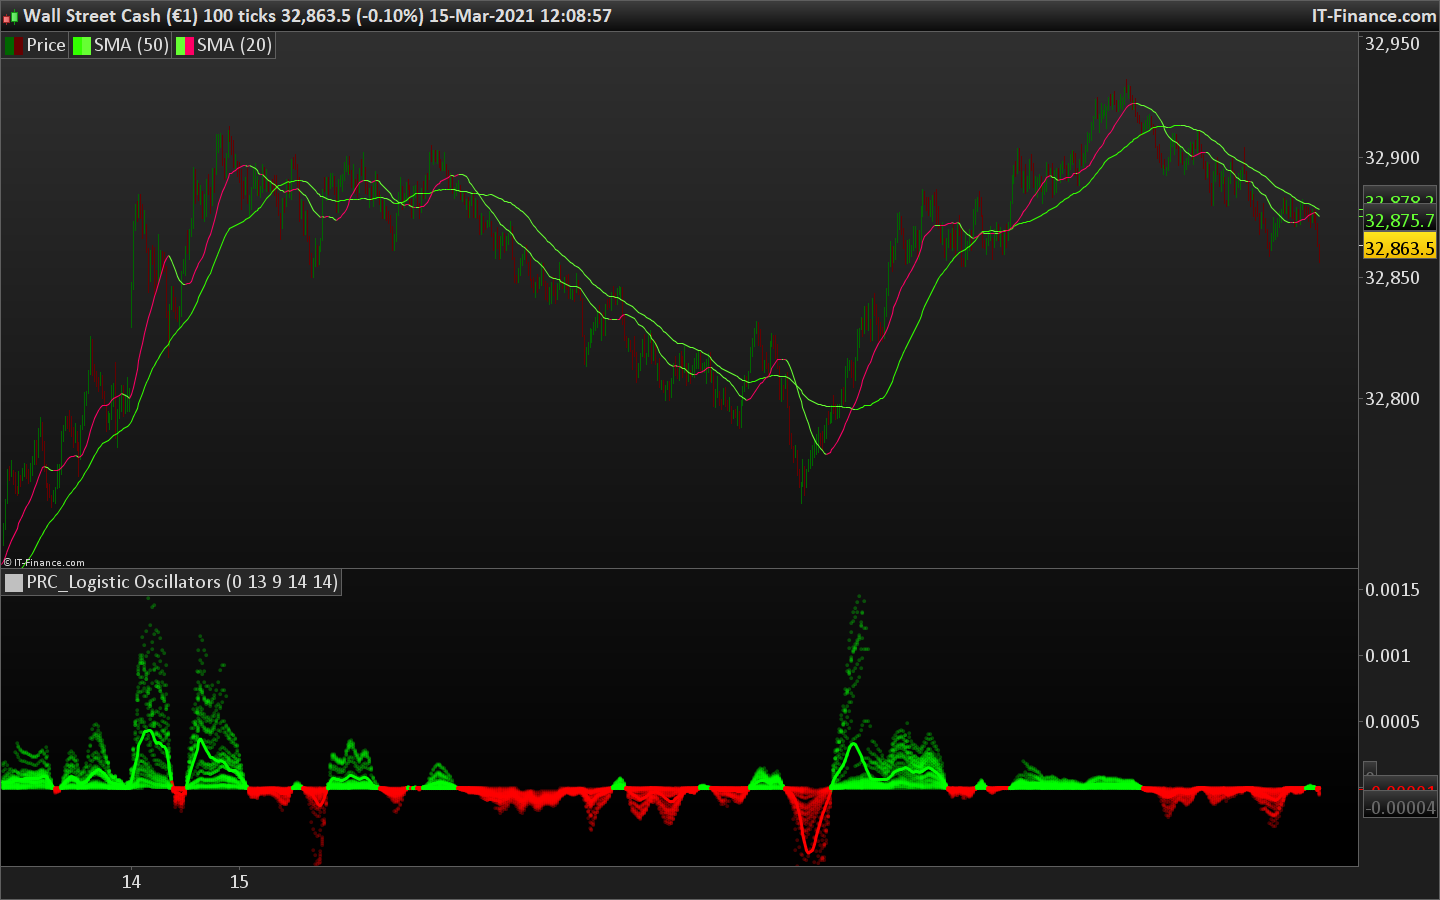
Logistic Oscillators
Experimental attemptt of applying Logistic Map Equation for some of widly used indicators. With this study “Awesome Oscillator (AO)”, “Rate of Change ( ROC )”, “Relative Strength Index ( RSI )”, “Stochastic ( STOCH )”.
Calculations with Logistic Map Equation makes sense when the calculated results are iterated many times within the same equation.
Here is the Logistic Map Equation : Xn+1 = r * Xn * (1 – Xn) Where, the value of r is the key for this equation which changes amazingly the behaviour of the Logistic Map.
The value we have asigned for r is less then 1 and greater than 0 ( 0 < r < 1) and in this case the iterations performed with the maximum number of output series allowed by Pine is quite enough for our purpose and thanks to arrays we can easiliy store them for further processing.
(description from original author DGT)
//PRC_Logistic Oscillators | indicator
//05.03.2021
//Nicolas @ www.prorealcode.com
//Sharing ProRealTime knowledge
//converted from pinescript

// --- settings
ti         = 0 //0=Awesome Oscillator (AO),1=Rate of Change (ROC),2=Relative Strength Index (RSI),3= Stochastic (STOCH)
length     = 13
lenROC     = 9 //Length : Rate of Change (ROC)
lenRSI     = 14 //Length : Relative Strength Index (RSI)
lenSTO     = 14 //Length : Stochastic (STOCH)
// --- end of settings

source     = customclose

if barindex>length then

if ti = 0 then
rr = average[5](medianprice)/average[34](medianprice)-1
elsif ti=1 then
rr = (source-source[lenROC])/source[lenROC]
elsif ti=2 then
rr = rsi[lenRSI](source)/100-.5
elsif ti=3 then
rr = 100*(source-lowest[lensto](low))/(highest[lensto](high)-lowest[lensto](low))/100-.5
endif

mapeq = rr*source / highest[length](high)*(1-source/highest[length](high))
lmap = mapeq*1000000
sum = 0
for i = 1 to 30
lmap = (rr * abs(mapeq[i]) * (1 - mapeq[i]))*1000000
sum=sum+lmap
$v[i]=lmap
next
avg = sum/30

for j = 1 to 30
if avg>0 then
r=0
g=255
else
r=255
g=0
endif
drawtext("●",barindex,$v[j],dialog,standard,5) coloured(r,g,0,70)
next

if avg>0 then
ar=0
ag=255
else
ar=255
ag=0
endif
endif

return 0 coloured(100,100,100,0),lmap coloured(100,100,100,0),avg coloured(ar,ag,0) style(line,3) as "average"