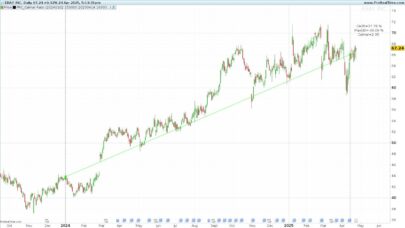
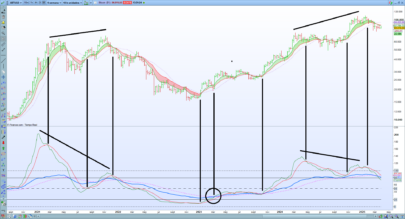
The value of this indicator is the difference (in %) between the maximum gain you could have obtained by entering a long position n days (periods) ago and entering a short position at the same time. Only opening prices are taken into acount, to model the behaviour of an ‘amateur’ trader who does not have access to a trading station during the day.
The computation is quite simple. First, imagine you entered a long position n days ago, buying one unit at opening price. Then, imagine you know in advance the highest opening price that will be reached between your entry date and the last day and that you sell at that time. You have a first figure that tells you how much you would have gained (in%). After that first gain, imagine you entered a short position n days ago by selling one unit at opening price. Then you know in advance when to buy back your position at the lowest possible opening price. You have a second figure that tells you how much you would have gained (in%). The final computation is to make the difference between both figures.
Parameters
Number of periods (n = 50)
|
1 2 3 4 5 6 7 |
o = OPEN[n] l = HIGHEST[n](OPEN) s = LOWEST[n](OPEN) RETURN 100 * (l + s - 2 * o) / o AS"Long/Short Differential Gain" |
Share this
No information on this site is investment advice or a solicitation to buy or sell any financial instrument. Past performance is not indicative of future results. Trading may expose you to risk of loss greater than your deposits and is only suitable for experienced investors who have sufficient financial means to bear such risk.
ProRealTime ITF files and other attachments :PRC is also on YouTube, subscribe to our channel for exclusive content and tutorials


