Introduction
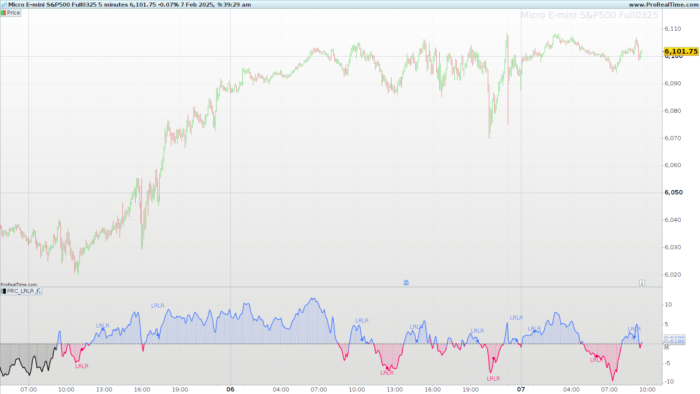
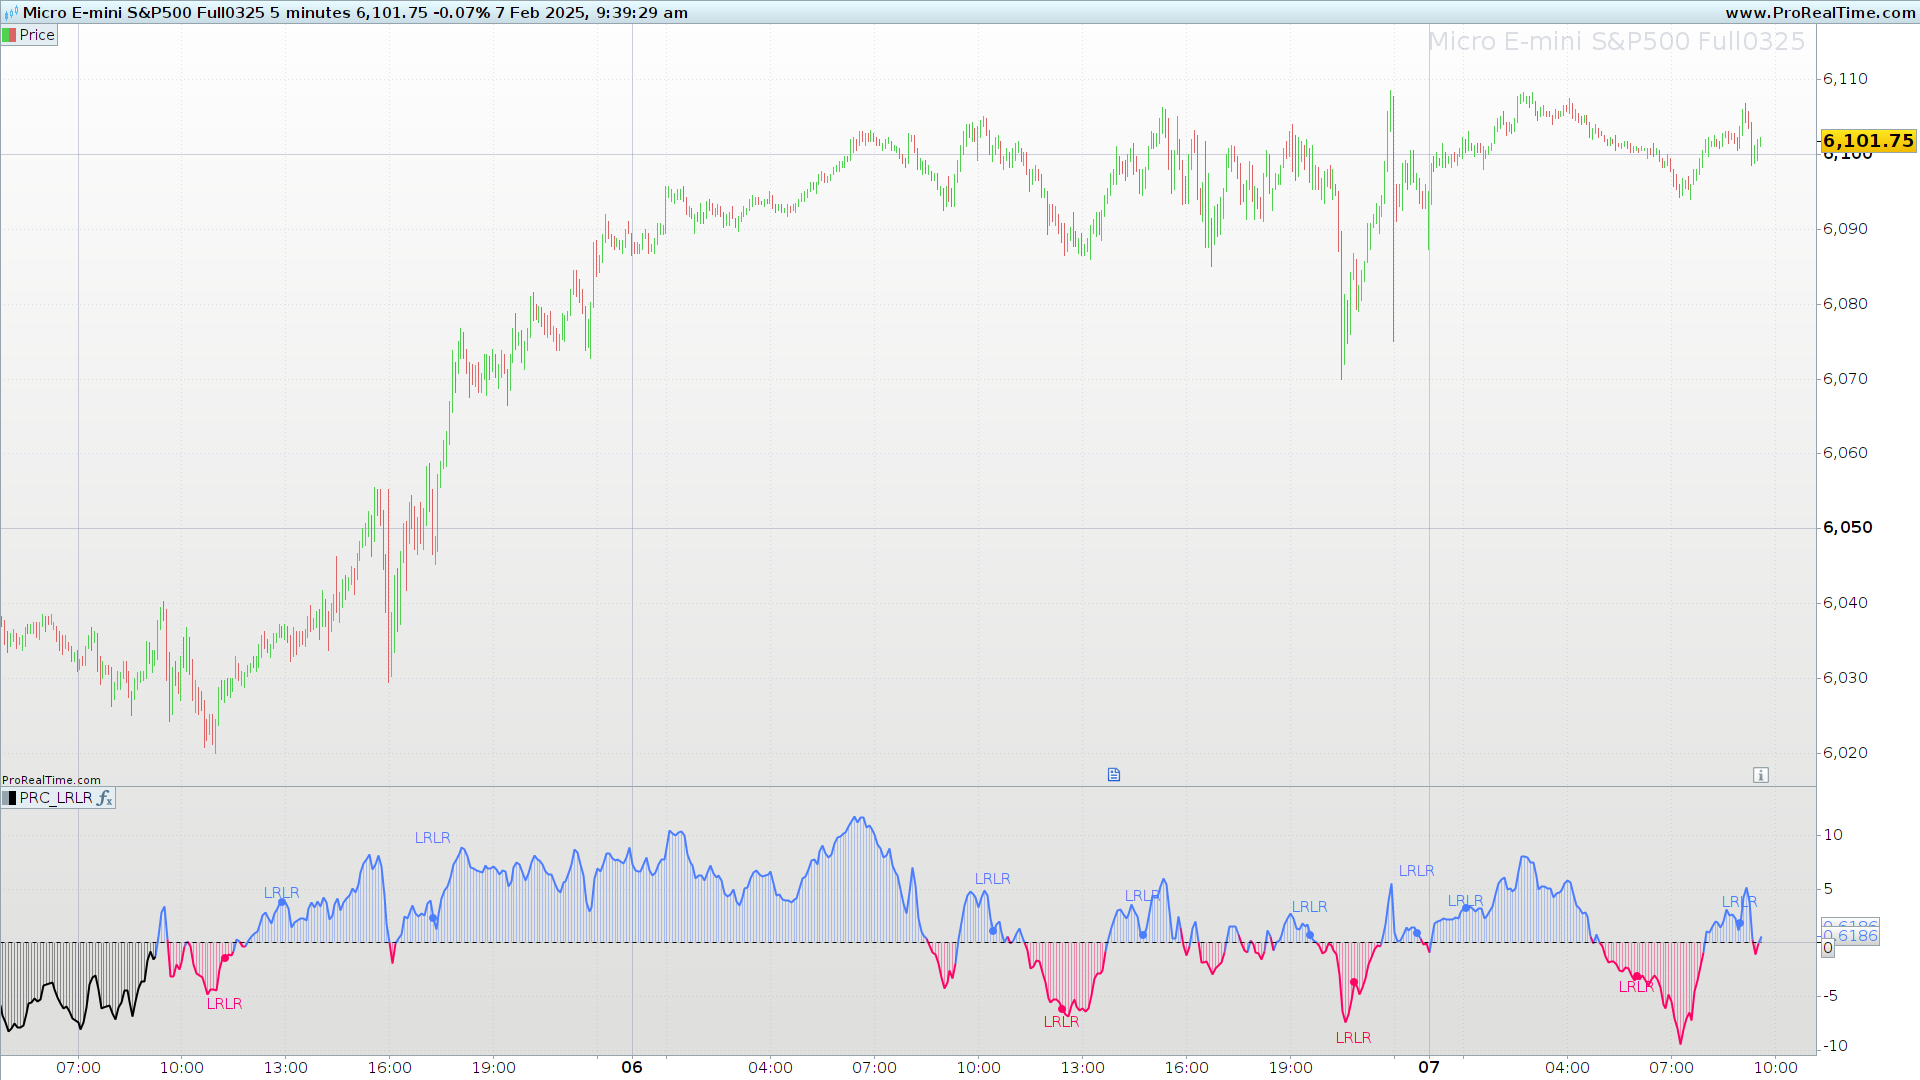
The LRLR indicator was originally presented by its creator Lukapex in a post where he described it as a tool to identify Low Resistance Liquidity Runs (LRLR) by detecting zones where the price remains above or below a reference line for at least one hour. Based on this logic, the indicator generates “LRLR” text signals directly on the chart.
In this article, we will explore the details of the indicator, highlight some interesting technical aspects of the code, and present an additional perspective: its use in detecting divergences with price, which can be a key function for many technical traders.
Indicator Inspiration
According to the author’s post, the primary purpose of the indicator is to replicate low-resistance areas. To achieve this, it uses the slope of a moving average and verifies whether this slope remains positive or negative for a defined period of time (one hour, in the original example), which then triggers the visual “LRLR” signal.
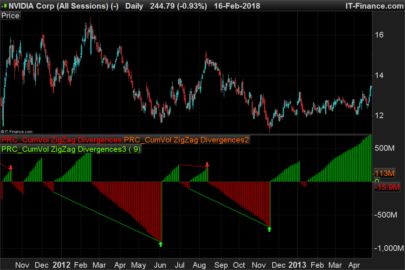
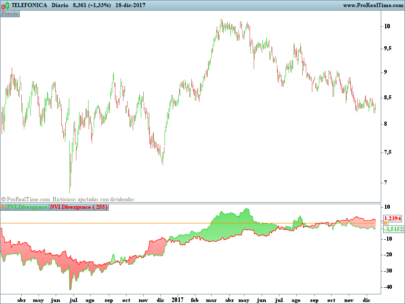
Beyond the utility described by its original creator, I would like to highlight another potential application of the indicator: detecting divergences between price and the slope of the moving average. This approach allows traders to identify zones where the market’s momentum and price behavior could be disconnected, which could signal potential reversals.
Technical Highlight: Variable Assignment Based on Timeframe
Although the indicator’s code is simple, I decided to create this article because it includes an interesting feature that could be useful for other indicators: the dynamic assignment of variable values based on the chart’s timeframe. The following code snippet demonstrates this concept:
|
1 2 3 4 5 6 7 8 9 10 11 12 13 14 15 |
if gettimeframe=60 then barsPerHour=60 elsif gettimeframe=180 then barsPerHour=20 elsif gettimeframe=300 then barsPerHour=12 elsif gettimeframe=600 then barsPerHour=6 elsif gettimeframe=900 then barsPerHour=4 elsif gettimeframe=1800 then barsPerHour=2 else barsPerHour=undefined endif |
This method automatically adjusts the number of bars per hour according to the chart’s timeframe, which simplifies the development of flexible and scalable indicators. Other programmers can use this technique when building indicators or strategies that need to adapt dynamically without manual intervention.
How the LRLR Indicator Works
The indicator combines the slope of a moving average with market volatility (measured using the Average True Range) to generate visual signals when trend changes are detected. Here’s a breakdown of the main steps:
- Calculating the moving average slope:
The typical price (Open+High+Low+Close)/4 is averaged over a user-defined period (default is 56). - Normalizing with the ATR:
The difference between the current and previous moving average values is divided by the ATR to get a relative slope. - Detecting slope changes:
The indicator detects when the slope switches from negative to positive (bullish change) or from positive to negative (bearish change). - Generating the “LRLR” signal:
If the slope remains positive or negative for the required number of bars, the indicator draws the “LRLR” signal on the chart.
Conclusion
The LRLR indicator not only provides an effective tool for detecting trend changes, but it also opens new possibilities for technical analysis through divergence detection. Additionally, the dynamic variable assignment feature showcased in the code is an excellent example for developers looking to create adaptable and flexible indicators.
|
1 2 3 4 5 6 7 8 9 10 11 12 13 14 15 16 17 18 19 20 21 22 23 24 25 26 27 28 29 30 31 32 33 34 35 36 37 38 39 40 41 42 43 44 45 46 47 48 49 50 51 52 53 54 55 56 57 58 59 60 61 62 63 64 65 66 67 68 69 70 |
//-------------------------------------------// //PRC_LRLR //version = 0 //06.02.2025 //Iván González @ www.prorealcode.com //Sharing ProRealTime knowledge //-------------------------------------------// // Inputs //-------------------------------------------// showLRLR=1 //Bars per hour if gettimeframe=60 then barsPerHour=60 elsif gettimeframe=180 then barsPerHour=20 elsif gettimeframe=300 then barsPerHour=12 elsif gettimeframe=600 then barsPerHour=6 elsif gettimeframe=900 then barsPerHour=4 elsif gettimeframe=1800 then barsPerHour=2 else barsPerHour=undefined showLRLR=0 endif //moving average period=56 src=(open+high+low+close)/4 //-------------------------------------------// // Determine Angle //-------------------------------------------// atr=averagetruerange[14](close) ma=average[period,1](src) maSlope=atan((ma-ma[1])/atr) //-------------------------------------------// // LRLR Detection //-------------------------------------------// changedAbove=maSlope>=0 and maSlope[1]<0 changedBelow=maSlope<=0 and maSlope[1]>0 countSinceChange=barssince(changedAbove or changedBelow) if changedAbove then isAbove=1 isBelow=0 r=75 g=125 b=255 elsif changedBelow then isAbove=0 isBelow=1 r=255 g=0 b=100 endif if showLRLR and countSinceChange=barsPerHour then if isAbove then drawtext("LRLR",barindex,highest[20](maSlope)*1.2)coloured(r,g,b) drawpoint(barindex,maSlope,2) else drawtext("LRLR",barindex,lowest[20](maSlope)*1.2)coloured(r,g,b) drawpoint(barindex,maSlope,2) endif endif //-------------------------------------------// return maSlope coloured(r,g,b)style(line,2),0 style(dottedline), maSlope style(histogram)coloured(r,g,b,100) |
Share this
No information on this site is investment advice or a solicitation to buy or sell any financial instrument. Past performance is not indicative of future results. Trading may expose you to risk of loss greater than your deposits and is only suitable for experienced investors who have sufficient financial means to bear such risk.
ProRealTime ITF files and other attachments :
Find other exclusive trading pro-tools on ![]()
PRC is also on YouTube, subscribe to our channel for exclusive content and tutorials


Thank you Ivan, very Useful! I would like translation of Trading View CCI_S Indicator, How I can ask you it? Thankk you in advance! Franco
hi, you can ask here: https://www.prorealcode.com/free-code-conversion/