1. Introduction
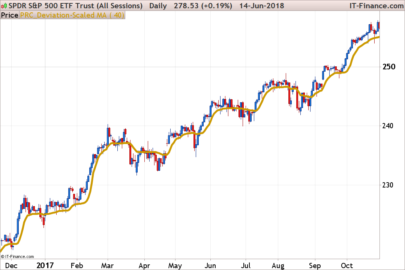
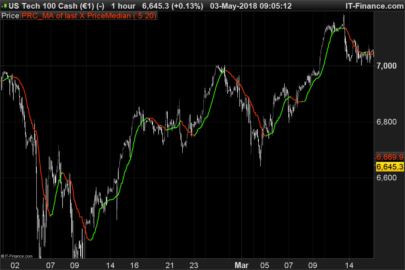
The MA BBands indicator combines Simple Moving Averages (SMA) and Bollinger Bands to provide a comprehensive analysis of price movements. This hybrid approach helps identify overbought and oversold zones, as well as potential trend breakouts. Additionally, it includes buy and sell signals based on OsMA crossovers, making decision-making more precise.
2. Key Concepts
- Simple Moving Average (SMA):
The SMA is calculated by averaging prices over a defined number of periods. It provides a smoothed line that reflects the general market direction. - Bollinger Bands:
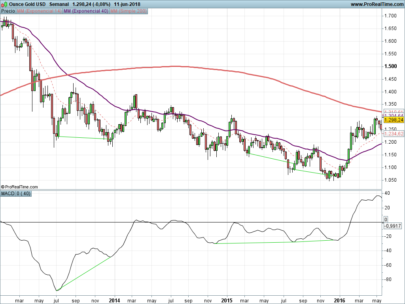
These consist of a central line (moving average) and two outer lines that represent a standard deviation range of prices. Bollinger Bands help measure market volatility. - OsMA (Moving Average Oscillator):
It measures the difference between the MACD and its signal line. OsMA sign changes indicate possible trend reversals. - Time Shifts:
Shifts allow observing past values of moving averages and bands to analyze their recent behavior.
3. Indicator Configuration
- MAPeriod (20): Period for the SMA.
- BBPeriod (30): Period for the Bollinger Bands.
- StdDev (1.5): Standard deviation factor for calculating the upper and lower bands.
- MoveShift (22): Number of bars to shift the SMA.
- OsMAFastPeriod (5) and OsMASlowPeriod (25): Parameters for calculating the OsMA.
- shortMAPeriod (10): Period for the short SMA used for quick entry and exit signals.
- ShowSignals (1): Parameter to enable/disable arrow signals display.
4. Indicator Logic
- Moving Average Calculation:
SMAs are calculated based on high and low prices, shifted according to theMoveShiftvalue. - Shifted Bollinger Bands:
An upper and lower range is derived based on a defined period and the standard deviation of prices. Then, a 7-bar shift is applied for more precise analysis. - OsMA Evaluation:
The OsMA is used to confirm the trend direction based on its sign changes. - Reference Bands Selection:
The upperBand and lowerBand lines dynamically adjust by selecting the most relevant value between the shifted SMA and Bollinger Bands, providing an adaptive framework for price evaluation.
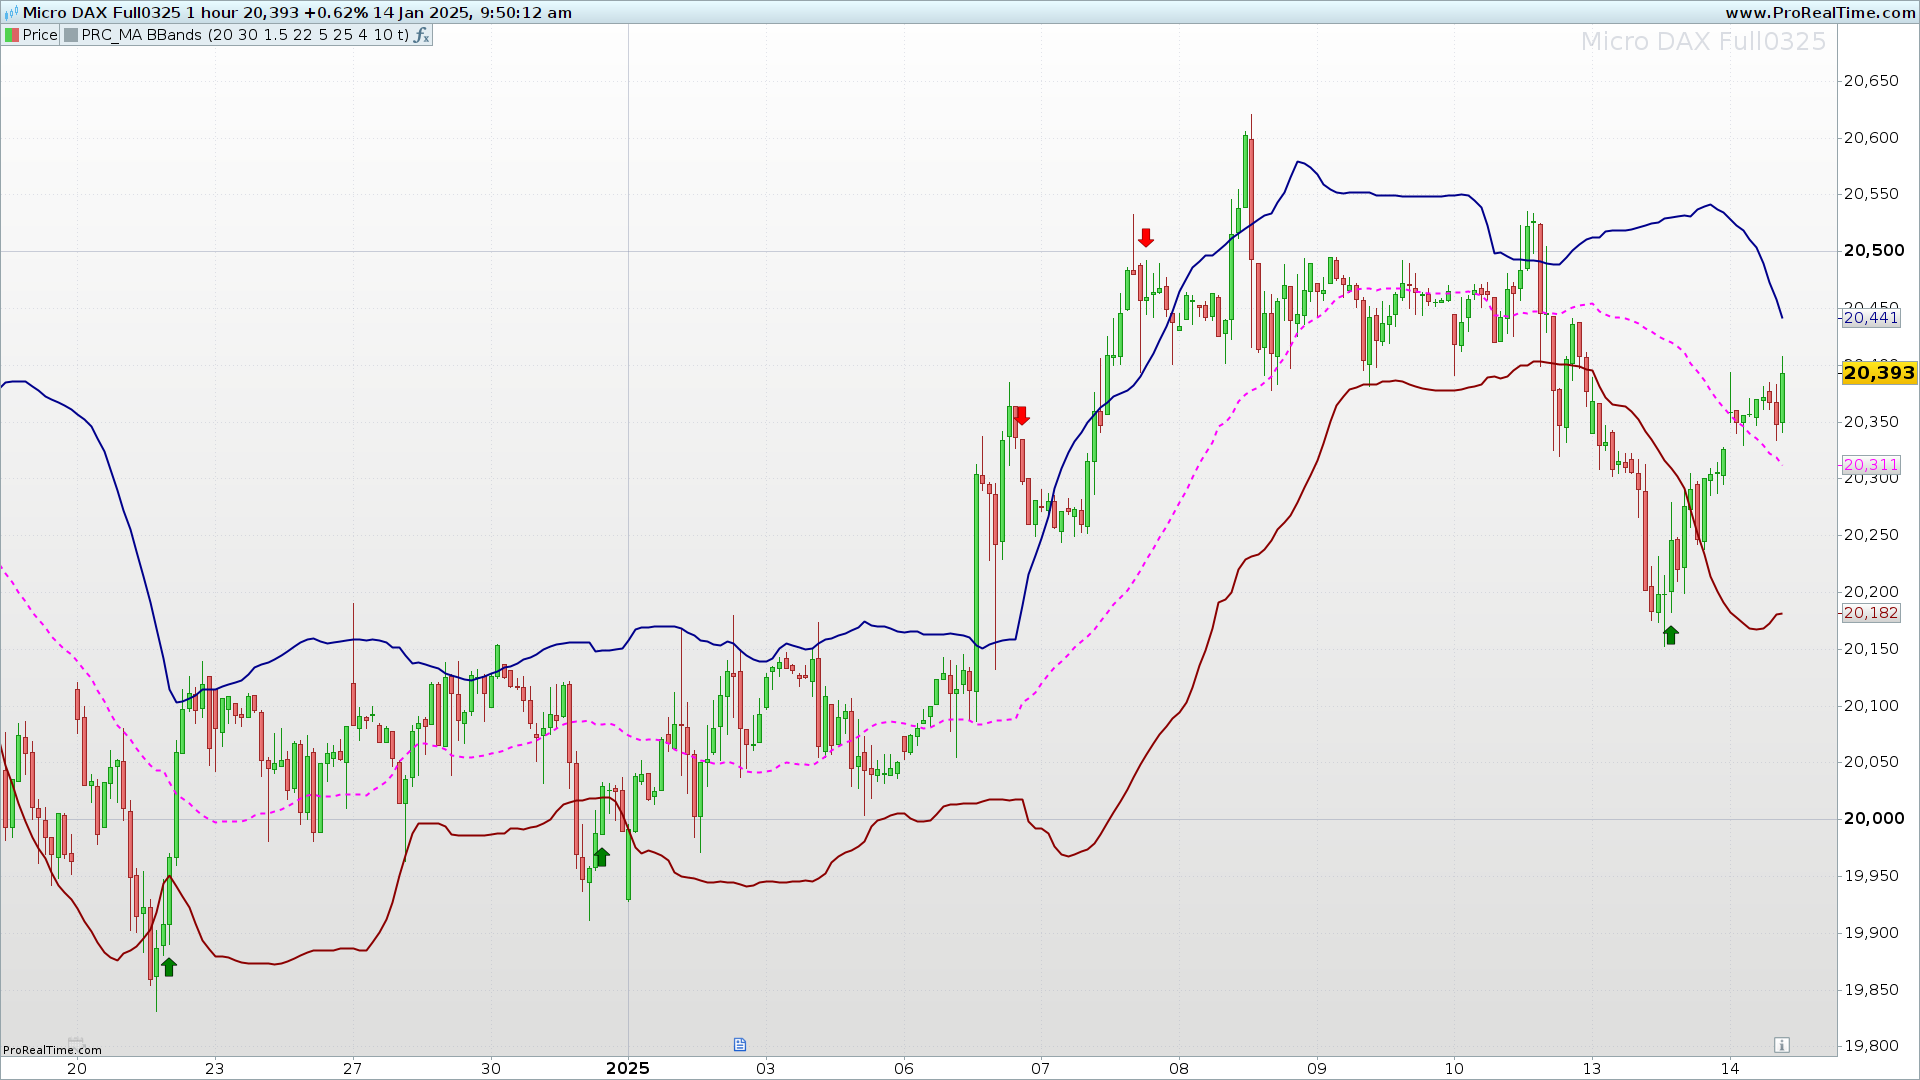
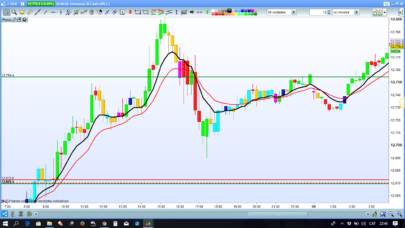
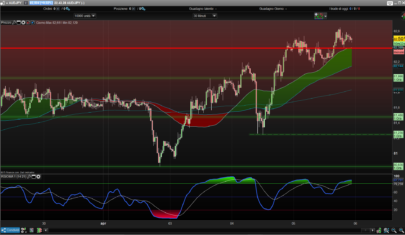
5. Buy and Sell Signals
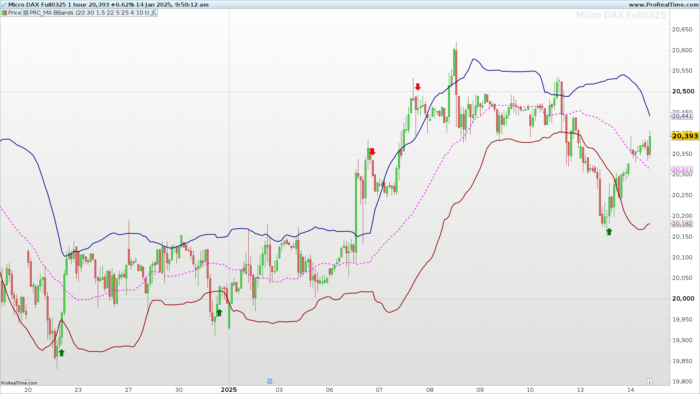
- Sell Signal (Red Arrow):
A sell signal is generated when:- The short SMA crosses above the upper band of the indicator.
- The OsMA changes from positive to negative.
- The current price closes above the upper band.
- Buy Signal (Green Arrow):
A buy signal is generated when:- The short SMA is below the lower band.
- The OsMA changes from negative to positive.
- The current price closes below the lower band.
6. Advantages of the MA BBands Indicator
- Provides clear and easy-to-interpret visual signals to detect overbought and oversold zones.
- Combines multiple technical approaches, improving signal accuracy and avoiding false breakouts.
- Allows customization of periods and standard deviations to suit different trading styles.
- The inclusion of the OsMA as a confirmation filter reduces market noise.
7. ProBuilder Code for the Indicator
|
1 2 3 4 5 6 7 8 9 10 11 12 13 14 15 16 17 18 19 20 21 22 23 24 25 26 27 28 29 30 31 32 33 34 35 36 37 38 39 40 41 42 43 44 45 46 47 48 49 50 51 52 53 54 55 56 57 58 59 60 61 62 63 64 65 66 67 68 69 70 71 72 73 74 75 76 77 78 79 80 81 82 83 84 |
// PRC_MA BBands // Version: 0 // 13.01.2025 // Iván González @ www.prorealcode.com // Sharing ProRealTime knowledge //----------------------------------------------------------------// // Configurable Parameters //----------------------------------------------------------------// MAPeriod = 20 // Moving Average period BBPeriod = 30 // Bollinger Bands period StdDev = 1.5 // Standard deviation for Bollinger Bands MoveShift = 22 // SMA shift OsMAFastPeriod = 5 // Fast EMA OsMASlowPeriod = 25 // Slow EMA OsMAPeriod = 4 // OsMA period shortMAPeriod = 10 // Short SMA period ShowSignals = 1 // Show signals //----------------------------------------------------------------// // Simple Moving Averages (SMA) Calculation //----------------------------------------------------------------// MAUp = average[MAPeriod](high) MAUpshift = MAUp[MoveShift] // Value of the SMA high shifted by 22 periods MADn = average[MAPeriod](low) MADnshift = MADn[MoveShift] // Value of the SMA low shifted by 22 periods //----------------------------------------------------------------// // Bollinger Bands Calculation with 7-Period Shift //----------------------------------------------------------------// bbUp = average[BBPeriod](high) + StdDev * std[BBPeriod](high) // Upper band using highs bbDn = average[BBPeriod](low) - StdDev * std[BBPeriod](low) // Lower band using lows bbUpShift = bbUp[7] // Upper band shifted by 7 periods bbDnShift = bbDn[7] // Lower band shifted by 7 periods //----------------------------------------------------------------// // OsMA Calculation //----------------------------------------------------------------// osmaNow = MACD[OsMAFastPeriod, OsMASlowPeriod, OsMAPeriod](close) // Current OsMA value osmaPrev = osmaNow[1] // Previous OsMA value //----------------------------------------------------------------// // Upper Band Calculation //----------------------------------------------------------------// IF MAUpshift > 0 THEN IF MAUpshift > bbUpShift THEN upperBand = MAUpshift // Assign SMA to the buffer ELSE upperBand = bbUpShift // Assign Bollinger upper band to the buffer ENDIF ELSE upperBand = bbUpShift ENDIF //----------------------------------------------------------------// // Lower Band Calculation //----------------------------------------------------------------// IF MADnshift > 0 THEN IF MADnshift < bbDnShift THEN lowerBand = MADnshift // Assign SMA low to the buffer ELSE lowerBand = bbDnShift // Assign Bollinger lower band to the buffer ENDIF ELSE lowerBand = bbDnShift ENDIF //----------------------------------------------------------------// // Midline //----------------------------------------------------------------// midLine = (upperBand + lowerBand) / 2 //----------------------------------------------------------------// // Short SMA Calculation //----------------------------------------------------------------// smaHighShort = average[shortMAPeriod](high)[1] // SMA of highs, shifted by one period smaLowShort = average[shortMAPeriod](low)[1] // SMA of lows, shifted by one period //----------------------------------------------------------------// // Sell Signals (Red Arrow) //----------------------------------------------------------------// IF ShowSignals AND smaHighShort > upperBand[1] AND osmaNow < 0 AND osmaPrev > 0 AND high > upperBand THEN drawarrowdown(barindex, high + 20 * pointsize) coloured("red") // Red arrow at the high price ENDIF //----------------------------------------------------------------// // Buy Signals (Green Arrow) //----------------------------------------------------------------// IF ShowSignals AND smaLowShort < lowerBand[1] AND osmaNow > 0 AND osmaPrev < 0 AND low < lowerBand THEN drawarrowup(barindex, low - 20 * pointsize) coloured("green") // Green arrow at the low price ENDIF //----------------------------------------------------------------// RETURN upperBand coloured("darkblue") style(line, 2), lowerBand coloured("darkred") style(line, 2), midLine coloured("fuchsia") style(dottedline, 2) |
Share this
No information on this site is investment advice or a solicitation to buy or sell any financial instrument. Past performance is not indicative of future results. Trading may expose you to risk of loss greater than your deposits and is only suitable for experienced investors who have sufficient financial means to bear such risk.
ProRealTime ITF files and other attachments :
Find other exclusive trading pro-tools on ![]()
PRC is also on YouTube, subscribe to our channel for exclusive content and tutorials