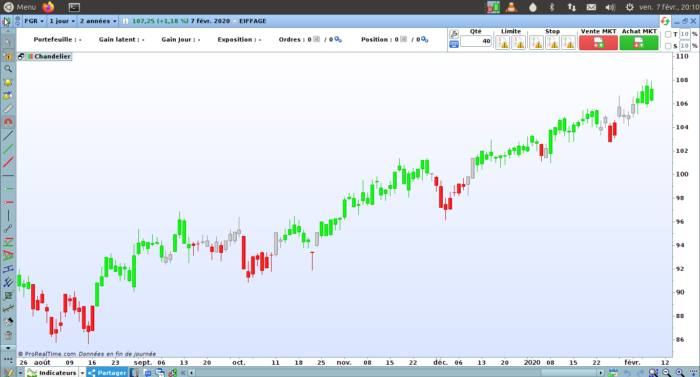
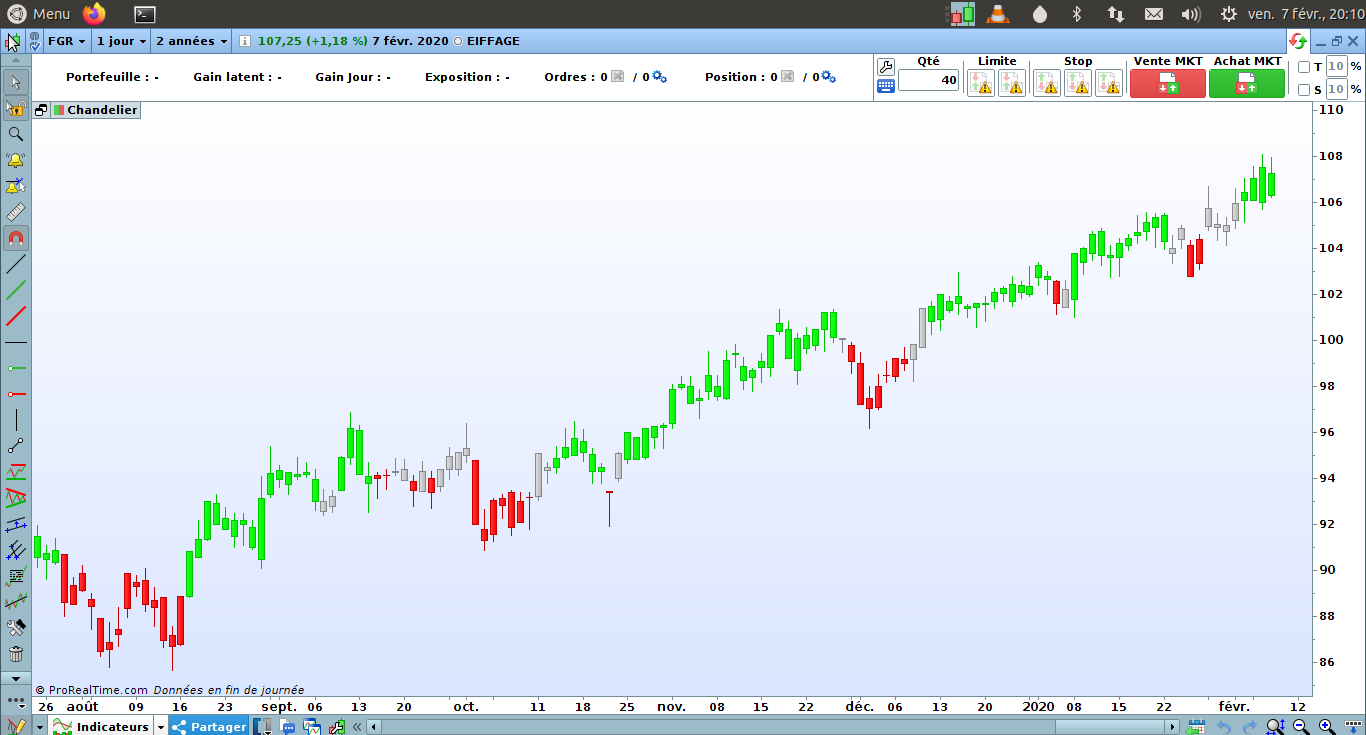
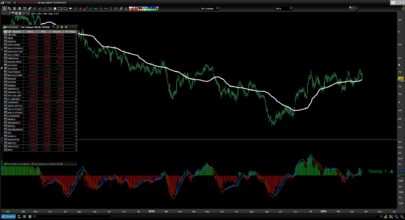
Paint the candlesticks with conditions based on CCI and MACD.
- green color when cci [14] > 0 and macd line > signal line
- red color when cci [14] < 0 and macd line < signal line
- grey color when cci > 0 and macd line< signal line or cci < 0 and macd line> signal line
|
1 2 3 4 5 6 7 8 9 10 11 12 13 14 15 16 17 18 19 20 21 22 23 24 25 26 27 28 29 |
// Variable a=CCI[14](typicalPrice) b=MACDline[12,26,9](close) c = ExponentialAverage[9](b) //Hausse if a > 0 and b > c then r = 0 b = 0 g = 255 //Baisse elsif a < 0 and b < c then r = 255 b = 0 g = 0 //Neutre elsif a > 0 and b < c OR a < 0 and b > c then r = 195 g = 195 b = 195 endif DRAWCANDLE(open,high,low,close) coloured(r,g,b) RETURN |
Share this
No information on this site is investment advice or a solicitation to buy or sell any financial instrument. Past performance is not indicative of future results. Trading may expose you to risk of loss greater than your deposits and is only suitable for experienced investors who have sufficient financial means to bear such risk.
ProRealTime ITF files and other attachments :PRC is also on YouTube, subscribe to our channel for exclusive content and tutorials







Thanks for sharing, this may be a useful filter but I’m not sure if it’s coded correctly since I only get red and gray candles but never any green ones regardless of which instrument and timeframe I try it on.
Yes, line 5 is truncated. I can’t edit, please replace by:
c=exponentialaverage[9](MACDLine[12,26,9](close))
Hi
I down loaded the ITF file, it paints red for a down trend but for all up trends the candles are grey. Could you advise how I get the candles to paint blue please
line 22: r = 195 by r = 0
line 23: g = 195 by g = 0
line 24: b = 195 by b = 255
😉