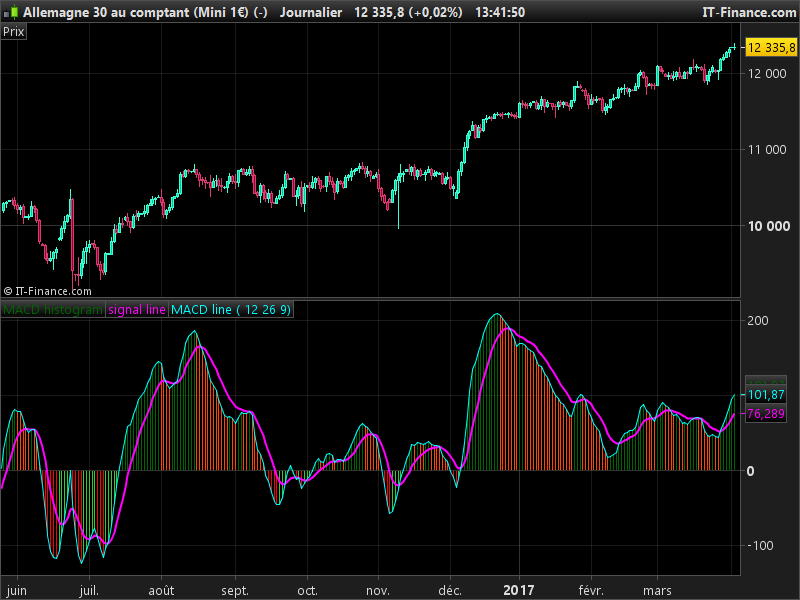
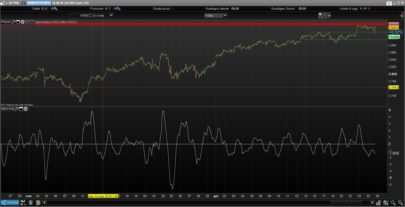
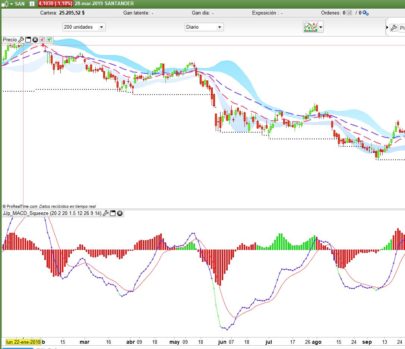
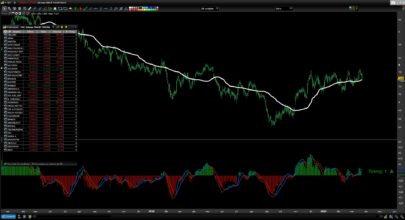
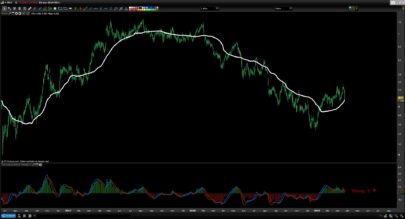
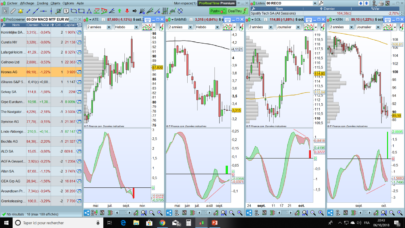
The MACD color histogram indicator is the classic MACD but with histogram coloured according to their directions : converging or diverging.
This indicator has been coded by a request on French forum.
The colours could modified by changing the Red, Green and Blue values in the code.
MACD settings are external variables and may be changed according to your needs.
|
1 2 3 4 5 6 7 8 9 10 11 12 13 14 15 16 17 18 19 20 21 22 23 24 25 26 27 28 29 30 31 32 33 34 35 36 37 38 39 |
//PRC_MACD color histogram | indicator //03.04.2017 //Nicolas @ www.prorealcode.com //Sharing ProRealTime knowledge //translated from MT4 code // --- settings //fast = 12 //slow = 26 //signalP = 9 // --- end of settings myMACD=exponentialaverage[fast]-exponentialaverage[slow] signal=exponentialaverage[signalP](myMACD) if myMACD>0 then if myMACD>myMACD[1] then r=0 g=100 b=0 else r=255 g=69 b=0 endif else if myMACD>myMACD[1] then r=50 g=205 b=50 else r=255 g=0 b=0 endif endif RETURN myMACD coloured(r,g,b) style(histogram) as "MACD histogram", signal coloured(255,0,255) style(line,2) as "signal line", myMACD coloured(0,255,255) style(line) as "MACD line" |
Share this
No information on this site is investment advice or a solicitation to buy or sell any financial instrument. Past performance is not indicative of future results. Trading may expose you to risk of loss greater than your deposits and is only suitable for experienced investors who have sufficient financial means to bear such risk.
ProRealTime ITF files and other attachments :PRC is also on YouTube, subscribe to our channel for exclusive content and tutorials




Nicolás, como puedo cambiar los colores porque para el histrograma quiero que sean más claros y para el macd quiero colores más intensos y líneas más gruesas.
Saludos
Luis
Para cambiar los colores del histograma, deben usarse las variables r, gyb entre las líneas 18 y 34. Esto corresponde a los valores rojo, verde y azul de cada histograma.
Hello, I was looking for a MACD Histogram with red and green bars according to the value of the previous bar and not only if above/below zero, thus I installed your version on Prorealtime. However it behaves completely different from the normal MACD.installed your MACD but it behaves completely different form the plain MACD. Can you help?
Hi,
it’s great to have this option of having a histogram coloured based on rising or falling slope…
but
i have the same question as leo above from 6 years ago…
this macd has very very different signals from the standard macd ???
Would be great if someone could clarify how to get this to behave the same way as the standard macd.
Merci beaucoup 🙂