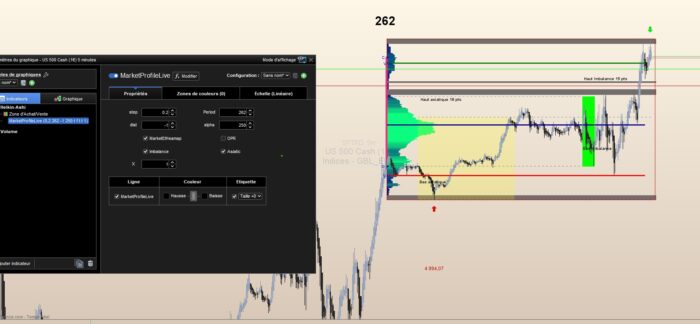
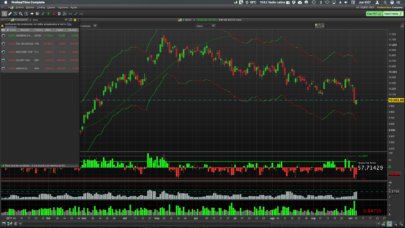
Market profile indicator for the ProRealTime trading platform, designed to analyze and display the distribution of trading activity over the current day. It calculates the market profile by examining the price levels at which trading activity occurs and highlights areas of high and low activity. This script employs several key features:
- Dynamic Range Calculation: It calculates the highest and lowest price levels within a specified period, adjusting dynamically as new data comes in.
- Volume Analysis: The script assesses the volume of trades at different price levels, identifying areas with significant trading activity. This feature uses an array to track the number of touches (i.e., instances where the price hits a specific level) to determine the most traded price levels (MaxTouch1 and MaxTouch2).
- Standard Deviation and Center Line (CL): It computes the standard deviation of prices to determine the volatility around the mean price level, along with the center line, to outline the Value Area High (VAH) and Value Area Low (VAL).
- Visualization Enhancements: The script uses rectangles and text annotations to visually represent the market profile, including the opening (O) and closing (C) prices, VAH, and VAL. It also highlights the highest and lowest prices reached within the session and marks specific periods of interest, such as the Asian session or periods of imbalance.
- Customizability: Parameters such as the period for calculations, ATR (Average True Range) for volatility assessment, and specific session times are customizable, allowing traders to adapt the indicator to their specific needs.
This indicator is particularly useful for traders who rely on volume profile analysis to make informed decisions, offering insights into where and how much trading activity is occurring at different price levels. It helps identify key support and resistance levels, areas of consolidation, and potential price movement directions based on historical trading activity.
|
1 2 3 4 5 6 7 8 9 10 11 12 13 14 15 16 17 18 19 20 21 22 23 24 25 26 27 28 29 30 31 32 33 34 35 36 37 38 39 40 41 42 43 44 45 46 47 48 49 50 51 52 53 54 55 56 57 58 59 60 61 62 63 64 65 66 67 68 69 70 71 72 73 74 75 76 77 78 79 80 81 82 83 84 85 86 87 88 89 90 91 92 93 94 95 96 97 98 99 100 101 102 103 104 105 106 107 108 109 110 111 112 113 114 115 116 117 118 119 120 121 122 123 124 125 126 127 128 129 130 131 132 133 134 135 136 137 138 139 140 141 142 143 144 145 146 147 148 149 150 151 152 153 154 155 156 157 158 159 160 161 162 163 164 165 166 167 168 169 170 171 172 173 174 175 176 177 178 179 180 181 182 183 184 185 186 187 188 189 190 191 192 193 194 195 196 197 198 199 200 201 202 203 204 205 206 207 208 209 210 211 212 213 214 215 216 217 218 219 220 221 222 223 224 225 226 227 228 229 230 231 232 233 234 235 236 237 238 239 240 241 242 243 244 245 246 247 248 249 250 251 252 253 254 255 256 257 258 259 260 261 262 263 264 265 266 267 268 |
defparam drawonlastbaronly=true once basculejour=1 once conte=0 once count=0 atr=AverageTrueRange[14](close) cont=period+count StopLookback=period voltot=0 pricelevel=0 nb=1 hh = Highest[cont](High) ll = Lowest[cont](Low) checkprice = ll MaxTouch1 = 0 if IsLastBarUpdate then For j = 1 To nb do COUNT = COUNT+1 for k = 0 To cont-1 do ind=0 //reset index of array //get the price touch occurrences for each level while checkprice<=hh do touch=0 //reset price touch for this price level for m = 0 to cont-1 do if High[cont*(j-1)+m]>=checkprice and Low[cont*(j-1)+m]<=checkprice then touch=touch+1 $hm[ind] = touch endif next if $hm[ind] > MaxTouch1 then MaxTouch1 = $hm[ind] MaxTouch2 = checkprice voltot=MaxTouch2 endif CL=(hh+ll)/2 StdDev = (hh- ll) / 2 VX=0.7 VAH=CL + StdDev *vx VAL=CL - StdDev * VX //define color r = min($hm[ind]*10,255) //plot the result if marketEtHeamap=1 then //drawtext("█",barindex+5+x,checkprice) coloured(r,0,0) //drawtext("#touch#",barindex+20+x,checkprice,SansSerif,Standard,10) coloured(110,110,110) if step>5 then endif drawrectangle(barindex[cont]-touch/(dist),checkprice-step/2,barindex[cont],checkprice+step/2)coloured(0,r,130,alpha)bordercolor(200,r,0,10) endif if touch<=1 then drawrectangle(barindex+5,checkprice-step/2,barindex[cont],checkprice+step/2)coloured(110,110,110,alpha)bordercolor(200,r,0,10) endif checkprice=checkprice+step //increase price check for next round ind=ind+1 //increase array index wend DrawText("#cont#",Barindex[cont+1]+x,hh+atr,Dialog,Bold,30) coloured(0,0,0,250) DRAWsegment(barindex-5-x, MaxTouch2, Barindex[cont], MaxTouch2) coloured(r,0,150,250)style(line,3) DRAWsegment(barindex-5-x, VAH, Barindex[cont], VAH) coloured(0,130,0,250)style(line,3) DRAWsegment(barindex-5-x, VAL, Barindex[cont], VAL) coloured(250,0,0,250)style(line,3) next next endif O=dopen(0) c=dclose(0) drawrectangle(Barindex[cont+1], o,Barindex[cont]+1, close) coloured(255,55,150,250) bordercolor(210,210,210,50) drawtext("O ➤---",Barindex[cont]+x,o*pipsize,Dialog,Standard,10) coloured(0,0,210,250) drawtext("C ➤---",Barindex[cont]+x,c*pipsize,Dialog,Standard,10) coloured(0,0,210) drawtext("VAH",Barindex[cont]+x, VAH*pipsize,Dialog,Standard,10) coloured(0,0,210,250) drawtext("VAL",Barindex[cont]+x, VAL*pipsize,Dialog,Standard,10) coloured(0,0,210,250) //drawtext("VAL",coordX+45, val) anchor(MIDDLE ,xshift,value)coloured(r,0,0) if IsLastBarUpdate then For j = 1 To nb do for i = 1 To StopLookback-1 do IF High[StopLookback*(j-1)+i]=hh[(j-1)*StopLookback] Then //hh=High[StopLookback*(j-1)+i] HighestI = BarIndex[StopLookback*(j-1)+i] //DRAWTEXT(hh[(j-1)*StopLookback]-x, HighestI, hh[(j-1)*StopLookback]+20, Dialog, Standard, 12) COLOURED(0,255,0) //DRAWARROWDOWN(HighestI-x,hh[(j-1)*StopLookback]+5) COLOURED(0,255,00) endif IF Low[StopLookback*(j-1)+i]=ll[(j-1)*StopLookback] Then //ll=Low[StopLookback*(j-1)+i] LowestI = BarIndex[StopLookback*(j-1)+i] //DRAWTEXT(ll[(j-1)*StopLookback]-x, LowestI, ll[(j-1)*StopLookback]-20, Dialog, Standard, 12) COLOURED(200,0,0) //DRAWARROWUP(LowestI-x,ll[(j-1)*StopLookback]-5) COLOURED(255,0,00) endif next next endif drawrectangle(barindex[cont],hh,barindex+4,ll)coloured(0,r,130,1)bordercolor(200,r,0,alpha) debutN = 150500 finN = 153500 // TRACE DU RECTANGLE DE L'OPR US IF time = debutN THEN hautN = 0 basN = 0 barredebutN = barindex ENDIF IF time = finN THEN barrefinN = barindex ENDIF IF time >= debutN AND time <= finN THEN IF high > hautN THEN hautN = high ENDIF IF low < basN OR time = debutN THEN basN = low ENDIF difN = round(abs(hautN-basN)) ENDIF if OPR=1 then IF time >= finN THEN DrawText(" OPR H #difn#pts",barredebutN,hautN+4*pointsize,Dialog,Bold,10) coloured(0,0,0,250) DrawText(" OPR B",barredebutN,basN+4*pointsize,Dialog,Bold,10) coloured(0,0,0,250) drawsegment(barredebutN,hautN,Barindex,hautN) coloured(0,0,0,50) STYLE (dottedline,2) DRAWRECTANGLE(barredebutN,hautN,barrefinN,basN) coloured(0,0,255,Alpha)bordercolor(0,0,255,Alpha) drawsegment(barredebutN,basN,Barindex,basN) coloured(0,0,0,50) STYLE (dottedline,2) ENDIF endif // heures de session debut = 010000 fin = 090000 dA = 010000 fA = 013000 // ... (le reste de votre script) // TRACE Le A dA = 010000 fA = 013000 barA=barindex i = 0 if OpenTime =dA and basculejour=1 then for i = 1 * pipsize to 6 * pipsize HA=close[i] NEXT endif // TRACE DU RECTANGLE DE SESSION ASIATIQUE IF time = debut THEN haut = 0 bas = 0 barredebut = barindex ENDIF IF time = fin THEN barrefin = barindex ENDIF IF time >= debut AND time <= fin THEN IF high > haut THEN haut = high ENDIF IF low < bas OR time = debut THEN bas = low ENDIF dif = round(abs(haut-bas)) ENDIF if asiatic=1 then IF time >= fin THEN DrawText(" Haut asiatique #dif#pts",barredebut,haut+4*pointsize,Dialog,Bold,10) coloured(0,0,0,250) DrawText(" Bas asiatique",barredebut,bas+4*pointsize,Dialog,Bold,10) coloured(0,0,0,250) drawsegment(barredebut,haut,Barindex,haut) coloured(0,0,0,50) STYLE (dottedline,2) DRAWRECTANGLE(barredebut,haut,barrefin,bas) coloured(255,255,0,50)bordercolor(255,255,0,1) drawsegment(barredebut,bas,Barindex,bas) coloured(0,0,0,50) STYLE (dottedline,2) ENDIF endif debutL = 143500 finL = 153500 // TRACE DU RECTANGLE DE SESSION ASIATIQUE IF time = debutL THEN hautL = 0 basL = 0 barredebutL = barindex ENDIF IF time = finL THEN barrefinL = barindex ENDIF IF time >= debutL AND time <= finL THEN IF high > hautL THEN hautL = high ENDIF IF low < basL OR time = debutL THEN basL = low ENDIF difL = round(abs(hautL-basL)) ENDIF if Imbalance=1 then IF time >= finL THEN DrawText(" Haut Imbalance #difL#pts",barredebutL,hautL+4*pointsize,Dialog,Bold,10) coloured(0,0,0,250) DrawText(" Bas Imbalance",barredebutL,basL+4*pointsize,Dialog,Bold,10) coloured(0,0,0,250) drawsegment(barredebutL,hautL,Barindex[period],hautL) coloured(0,0,0,50) STYLE (dottedline,2) DRAWRECTANGLE(barredebutL,hautL,barrefinL,basL) coloured(0,255,0,Alpha)bordercolor(0,255,0,Alpha) drawsegment(barredebutL,basL,Barindex[period],basL) coloured(0,0,0,50) STYLE (dottedline,2) ENDIF endif if IsLastBarUpdate then For j = 1 To nb do for i = 1 To StopLookback-1 do IF High[StopLookback*(j-1)+i]=hh[(j-1)*StopLookback] Then //hh=High[StopLookback*(j-1)+i] HighestI = BarIndex[StopLookback*(j-1)+i] DRAWTEXT(hh[(j-1)*StopLookback], HighestI, hh[(j-1)*StopLookback]+15, Dialog, Standard, 12) COLOURED(0,255,0) DRAWARROWDOWN(HighestI,hh[(j-1)*StopLookback]+2) COLOURED(0,255,00) endif IF Low[StopLookback*(j-1)+i]=ll[(j-1)*StopLookback] Then //ll=Low[StopLookback*(j-1)+i] LowestI = BarIndex[StopLookback*(j-1)+i] DRAWTEXT(ll[(j-1)*StopLookback], LowestI, ll[(j-1)*StopLookback]-15, Dialog, Standard, 12) COLOURED(200,0,0) DRAWARROWUP(LowestI,ll[(j-1)*StopLookback]-2) COLOURED(255,0,00) endif next next endif // Paramètres periode = 20 // Periode pour les calculs // Calcul des moyennes mobiles moyenneHaut = Average[periode](high) moyenneBas = Average[periode](low) volumeTotal = Average[periode](volume) // Estimation de la Value Area VAH = moyenneHaut // Estimation de Value Area High VAL = moyenneBas // Estimation de Value Area Low // Dessiner la Value Area DRAWLINE(BarIndex[periode], VAH, BarIndex, VAH) COLOURED(0, 255, 0) // Ligne verte pour la VAH DRAWLINE(BarIndex[periode], VAL, BarIndex, VAL) COLOURED(255, 0, 0) // Ligne rouge pour la VAL return |
Share this
No information on this site is investment advice or a solicitation to buy or sell any financial instrument. Past performance is not indicative of future results. Trading may expose you to risk of loss greater than your deposits and is only suitable for experienced investors who have sufficient financial means to bear such risk.
ProRealTime ITF files and other attachments :
Find other exclusive trading pro-tools on ![]()
PRC is also on YouTube, subscribe to our channel for exclusive content and tutorials


Sembra molto interessante e volevo dei chiarimenti se possibile :Le righe commentate vanno lasciate cosi come sono? Potresti inoltre spigare le funzioni delle varie linee?
Grazie
Thank you @philippe59139 !! We finally have the VAL / VAH to play with.
Could you attach the screenshot in higher resolution ? Merci 🙂
Merci @pilippe59139 pour le travail que vous partagez. Vos programmes sont vraiment au top.
Merci Yanntorp
Bonjour
Je pense que votre indicateur est très bon. Serait-il possible d’afficher la heatmap sur le côté droit ?
Merci de partager cet indicateur avec nous.
if marketEtHeamap=1 then
drawtext(“#touch#”,barindex+10,checkprice,SansSerif,Standard,10) coloured(110,110,110)
drawtext(“████”,barindex+10,checkprice) coloured(r,0,0,alpha)
if step>5 then
endif
drawrectangle(barindex[cont]-touch/(dist),checkprice-step/2,barindex[cont],checkprice+step/2)coloured(0,r,130,alpha)bordercolor(200,r,0,10)
endif
if touch<=1 then
drawrectangle(barindex+5,checkprice-step/2,barindex[cont],checkprice+step/2)coloured(110,110,110,alpha)bordercolor(200,r,0,10)
endif
checkprice=checkprice+step //increase price check for next round
ind=ind+1 //increase array index
wend
DrawText("#cont#",Barindex[cont+1]+10,hh+atr,Dialog,Bold,30) coloured(0,0,0,250)
DRAWsegment(barindex, MaxTouch2, Barindex[cont], MaxTouch2) coloured(r,0,150,250)style(line,3)
DRAWsegment(barindex, VAH, Barindex[cont], VAH) coloured(0,130,0,250)style(line,3)
DRAWsegment(barindex, VAL, Barindex[cont], VAL) coloured(250,0,0,250)style(line,3)
next
next
endif
O=dopen(0)
c=dclose(0)
drawrectangle(Barindex[cont+1], o,Barindex[cont]+1, close) coloured(255,55,150,250) bordercolor(210,210,210,50)
drawtext("O ➤—",Barindex[cont]+x,o*pipsize,Dialog,Standard,10) coloured(0,0,210,250)
drawtext("C ➤—",Barindex[cont]+x,c*pipsize,Dialog,Standard,10) coloured(0,0,210)
drawtext("VAH",Barindex[cont]+x, VAH*pipsize,Dialog,Standard,10) coloured(0,0,210,250)
drawtext("VAL",Barindex[cont]+x, VAL*pipsize,Dialog,Standard,10) coloured(0,0,210,250)
//drawtext("VAL",coordX+45, val) anchor(MIDDLE ,xshift,value)coloured(r,0,0)
if IsLastBarUpdate then
For j = 1 To nb do
for i = 1 To StopLookback-1 do
IF High[StopLookback*(j-1)+i]=hh[(j-1)*StopLookback] Then
//hh=High[StopLookback*(j-1)+i]
HighestI = BarIndex[StopLookback*(j-1)+i]
//DRAWTEXT(hh[(j-1)*StopLookback]-x, HighestI, hh[(j-1)*StopLookback]+20, Dialog, Standard, 12) COLOURED(0,255,0)
//DRAWARROWDOWN(HighestI-x,hh[(j-1)*StopLookback]+5) COLOURED(0,255,00)
endif
IF Low[StopLookback*(j-1)+i]=ll[(j-1)*StopLookback] Then
//ll=Low[StopLookback*(j-1)+i]
LowestI = BarIndex[StopLookback*(j-1)+i]
//DRAWTEXT(ll[(j-1)*StopLookback]-x, LowestI, ll[(j-1)*StopLookback]-20, Dialog, Standard, 12) COLOURED(200,0,0)
//DRAWARROWUP(LowestI-x,ll[(j-1)*StopLookback]-5) COLOURED(255,0,00)
endif
next
next
endif
drawrectangle(barindex[cont],hh,barindex+4,ll)coloured(0,r,130,1)bordercolor(200,r,0,alpha)
drawtext("████",barindex+10,MaxTouch2) coloured(r,0,150,250)
drawtext("████",barindex+10,VAH) coloured(0,130,0,250)
drawtext("████",barindex+10,VAL) coloured(250,0,0,250)
voici pour toi RAZZ il te faut simplement ajouter les drawtext
https://www.prorealcode.com/topic/marketprofileliveserait-il-possible-dafficher-la-heatmap-sur-le-cote-droit/