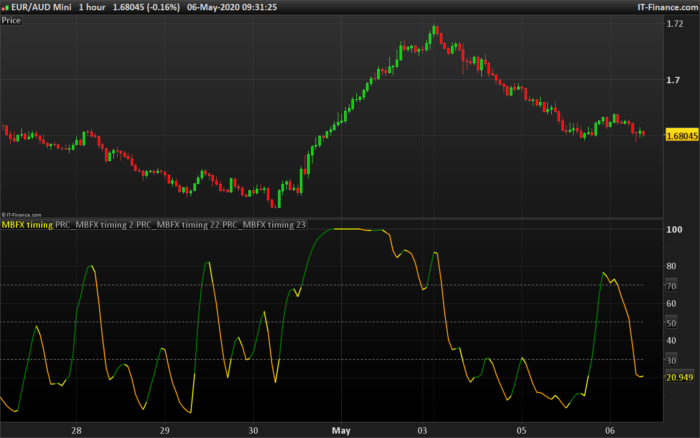
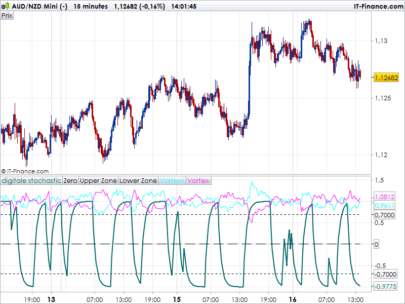
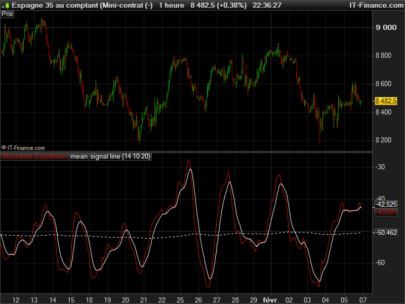
The MBFX Timing indicator is a part of the well-known forex “MOSTAFA BELKHAYATE” system.
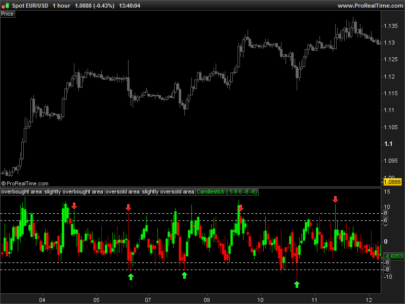
In fact, MBFX Timing indicator could be compared to a classic stochastic oscillator. It works on a similar principle.
How to trade with the MBFX Timing Indicator?
Look for BUY opportunities when:
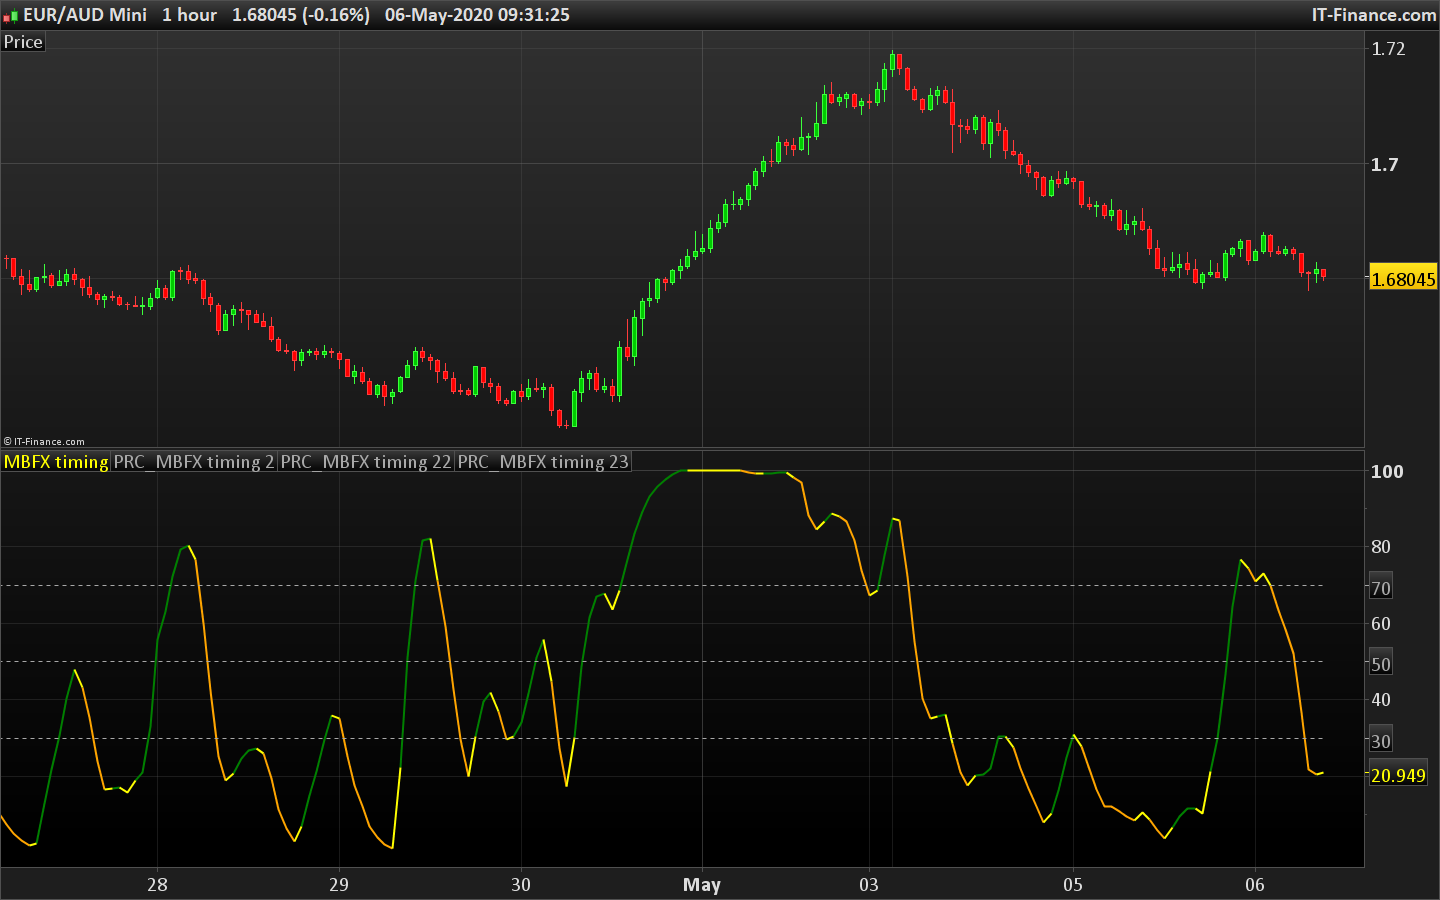
MBFX Timing indicator reaches the oversold zone (low levels of the scale).
Late confirmation is line color change to yellow.
Look for SELL opportunities when:
MBFX Timing indicator reaches the overbought zone (high levels of the scale).
Late confirmation is line color change to yellow.
This version 2 seems to be the most comparable to the original strategy than the other older MBFX timing indicator version posted in the library. People would like to trade on the same principle than the Belkhayate system should use this one.
|
1 2 3 4 5 6 7 8 9 10 11 12 13 14 15 16 17 18 19 20 21 22 23 24 25 26 27 28 29 30 31 32 33 34 35 36 37 38 39 40 41 42 43 44 45 46 47 48 49 50 51 52 53 54 55 56 57 58 59 60 61 62 63 64 65 66 67 68 69 70 71 72 73 74 75 76 77 78 79 80 81 82 83 84 85 86 87 88 89 90 |
//PRC_MBFX timing 2 | indicator //06.05.2020 //Nicolas @ www.prorealcode.com //Sharing ProRealTime knowledge //converted from MT4 version // --- settings Len = 7 Filter = 0.0 // --- end of settings li224=0 if (ld8 = 0.0) then ld8 = 1.0 ld16 = 0.0 if (Len - 1 >= 5) then ld0 = Len - 1.0 else ld0 = 5.0 endif ld80 = 100.0 * ((High[li224] + Low[li224] + Close[li224]) / 3.0) ld96 = 3.0 / (Len + 2.0) ld104 = 1.0 - ld96 else if (ld0 <= ld8) then ld8 = ld0 + 1.0 else ld8 = ld8+1.0 endif ld88 = ld80 ld80 = 100.0 * ((High[li224] + Low[li224] + Close[li224]) / 3.0) ld32 = ld80 - ld88 ld112 = ld104 * ld112 + ld96 * ld32 ld120 = ld96 * ld112 + ld104 * ld120 ld40 = 1.5 * ld112 - ld120 / 2.0 ld128 = ld104 * ld128 + ld96 * ld40 ld208 = ld96 * ld128 + ld104 * ld208 ld48 = 1.5 * ld128 - ld208 / 2.0 ld136 = ld104 * ld136 + ld96 * ld48 ld152 = ld96 * ld136 + ld104 * ld152 ld56 = 1.5 * ld136 - ld152 / 2.0 ld160 = ld104 * ld160 + ld96 * Abs(ld32) ld168 = ld96 * ld160 + ld104 * ld168 ld64 = 1.5 * ld160 - ld168 / 2.0 ld176 = ld104 * ld176 + ld96 * ld64 ld184 = ld96 * ld176 + ld104 * ld184 ld144 = 1.5 * ld176 - ld184 / 2.0 ld192 = ld104 * ld192 + ld96 * ld144 ld200 = ld96 * ld192 + ld104 * ld200 ld72 = 1.5 * ld192 - ld200 / 2.0 if (ld0 >= ld8 and ld80 <> ld88) then ld16 = 1.0 endif if (ld0 = ld8 and ld16 = 0.0) then ld8 = 0.0 endif endif if (ld0 < ld8 and ld72 > 0.0000000001) then ld24 = 50.0 * (ld56 / ld72 + 1.0) if (ld24 > 100.0) then ld24 = 100.0 endif if (ld24 < 0.0) then ld24 = 0.0 endif else ld24 = 50.0 endif if (ld24>ld24[1]- Filter) then dirbar=1 r=0 g=128 endif if (ld24<ld24[1]+Filter) then dirbar=-1 r=255 g=165 endif if (ld24=ld24[1]+Filter) then dirbar=0 endif if dirbar<>dirbar[1] then r=255 g=255 endif return ld24 coloured(r,g,0) style(line,2) as "MBFX timing",70 coloured(168,168,168) style(dottedline), 30 coloured(168,168,168) style(dottedline), 50 coloured(168,168,168) style(dottedline) |
Share this
No information on this site is investment advice or a solicitation to buy or sell any financial instrument. Past performance is not indicative of future results. Trading may expose you to risk of loss greater than your deposits and is only suitable for experienced investors who have sufficient financial means to bear such risk.
ProRealTime ITF files and other attachments :PRC is also on YouTube, subscribe to our channel for exclusive content and tutorials



I have tested this indicator, this is most powerful indicator for trend trading. Len=1 , indicator 100 buy, indicator 0 sell. works well on 10 or 15 min. thanks for providing holy grail
Hello rama,
how do you come up with these parameters? Have you back-tested these?
A visual test in the Dow Jones in the M10 shows me many false signals without considering other factors.
you need set Len=1, check your stop loss if is 10 take only trades which fits into stop loss. when indicator is 100 buy
yes every signal we should not take trade take only that fits into stop loss and risk reward criteria
Just an update to match the buy and sell lines to the original indicator:
(code didn’t appear in Add PRT code Chrome browser?)
return ld24 coloured(r,g,0) style(line,2) as “MBFX timing”, 10 coloured(0,255,0) style(dottedline,2) as “Buy Line 2”, 30 coloured(0,255,0) style(dottedline,2) as “Buy Line 1”, 50 coloured(100,100,100) style(dottedline,2) as “Mid Line”, 70 coloured(255, 0, 0) style(dottedline,2) as “Sell Line 1”, 90 coloured(255, 0, 0) style(dottedline,2) as “Sell Line 2”
Not optimised values. Simply tried Len = 5 (well 5 days in the week and all that).
Buy on Cross Over of Buy Line 2 and Cross Under of Sell Line 2.
Daily mean reverting currencies: USD/CHF, GBP/USD, USD/JPY, even the Dow (but not Dax, FTSE, Silver or Brent LCO). 2 yrs data.
Spread = 4.
Not bad. Low Drawdown too.
eg: Dropbox USD/JPY,
tiny.cc/ijdsoz
Click “No thanks continue…”
Nice going Nicolas, It’s now like the original indicator with the colour coded signal line.
@rama could you tell use what do you trade and the fimeframe you use with Len=1 ? Would like to see why you can consider this as a holy grail. Thanks
Bonjour auriez vous son équivalent sur Ninjatrader? Merci pour votre retour
Hello would someone be willing to release a scan code for this? that would be helpful as I sent out a programming request to support. When the oscillator is above 70 and is yellow for shorting and when the oscillator is below 30 and green for buying? Thanks.
You can do easily this screener by using the assisted creation tool. It would take you about 5 minutes.
I just figured it out thanks!