
1. Introduction
Mean reversion is a key concept in technical analysis, suggesting that asset prices tend to revert to their average value after significant deviations. This behavior is particularly useful in sideways or highly volatile markets, where buying and selling opportunities arise when prices reach extreme levels.
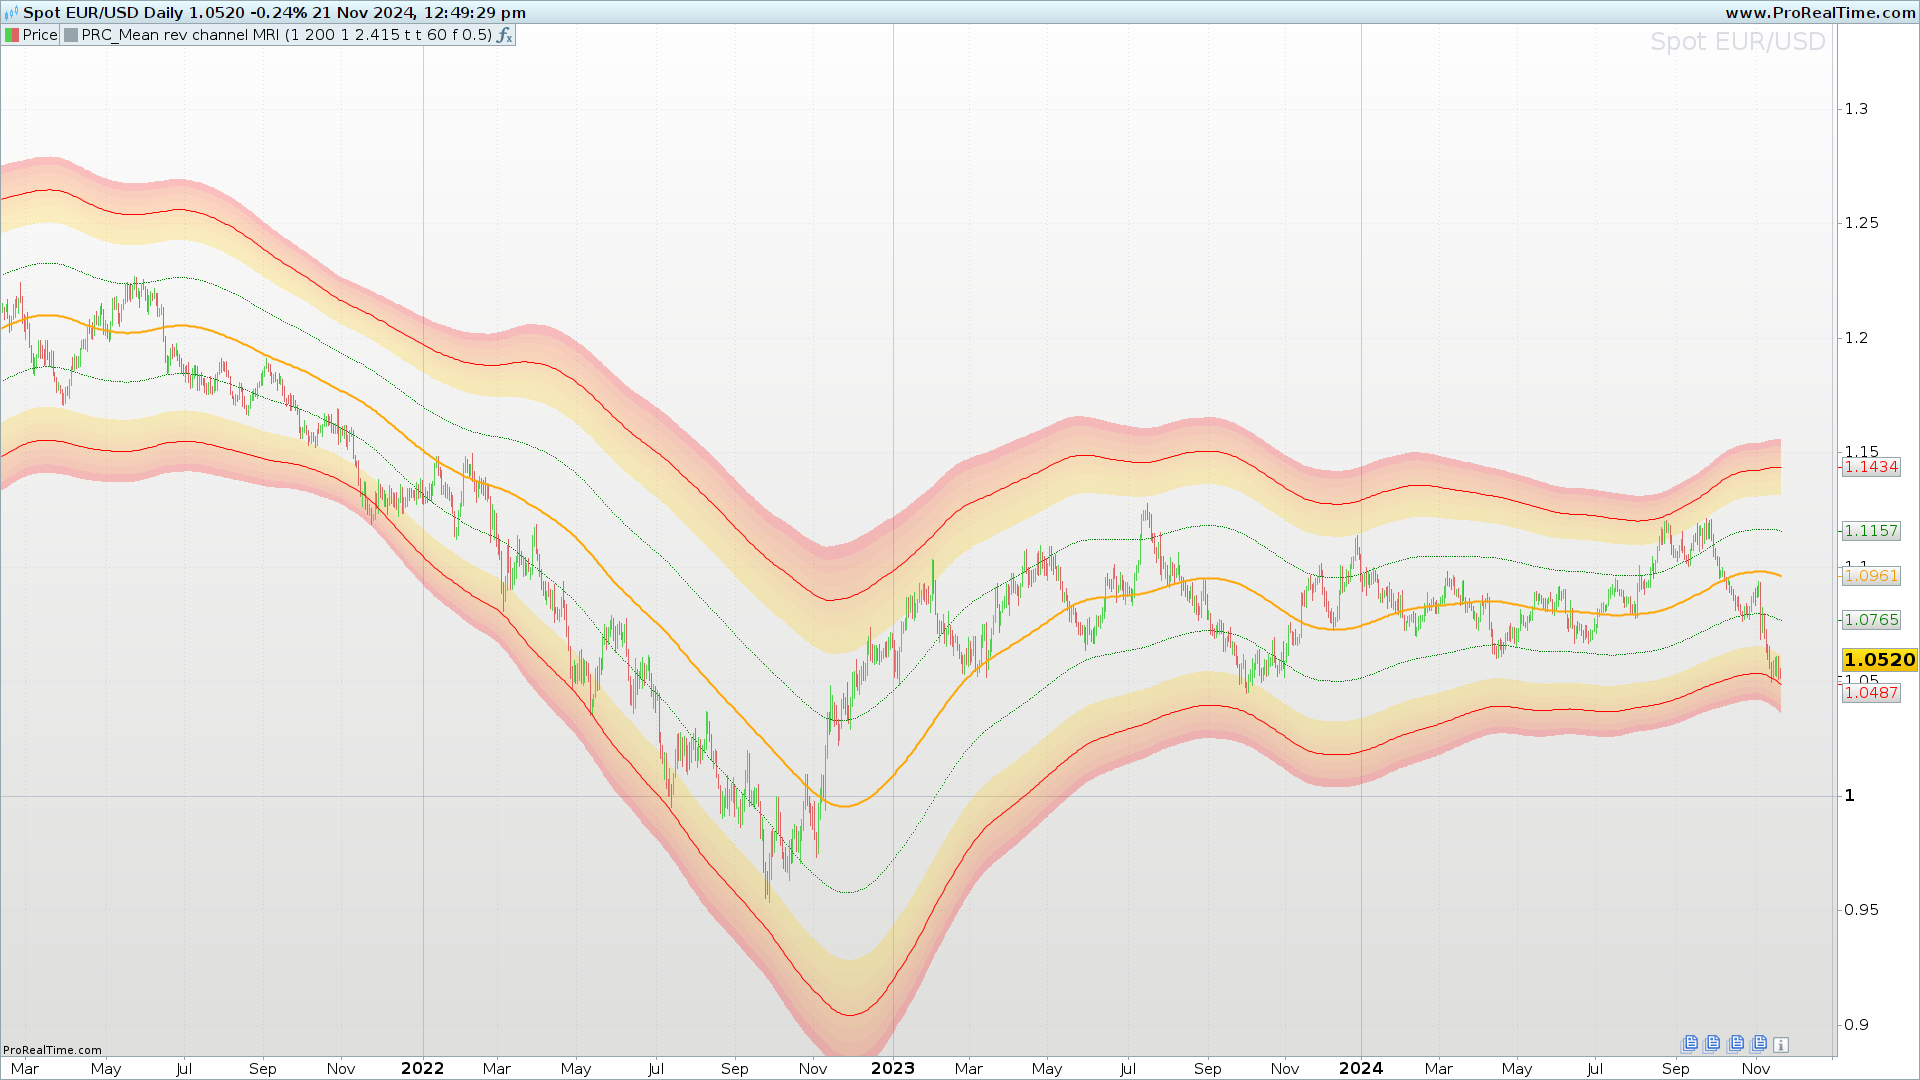
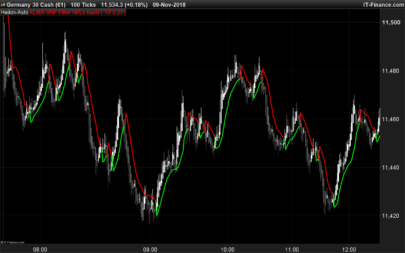
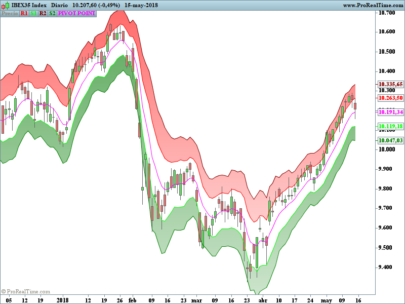
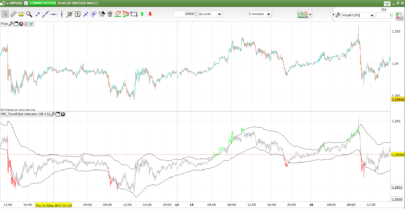
The Mean Reversion Channel (MRI) is designed to identify these reversion zones using dynamic channels and visual gradients. Its advanced structure not only detects critical levels but also evaluates the strength of signals based on the price’s position within the channel.
2. What is the Mean Reversion Channel (MRI)?
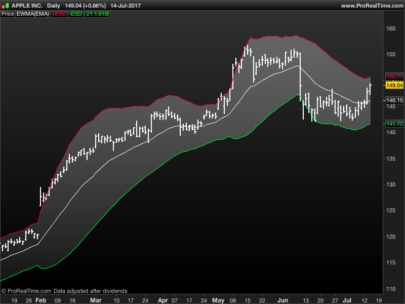
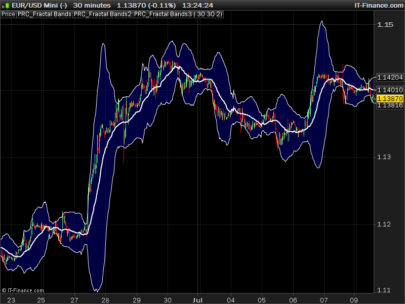
The Mean Reversion Channel (MRI) is a technical indicator that combines moving averages, volatility, and probability channels to provide a clear view of overbought and oversold zones. This visually intuitive tool highlights different gradient zones on the chart, helping traders make decisions based on clear data.
Its primary focus is to identify:
- High-probability reversion zones: Based on the price’s distance from the mean.
- Movement intensity: Represented by colors and gradients that emphasize critical areas.
3. Key Components of the Indicator
The MRI consists of the following main elements:
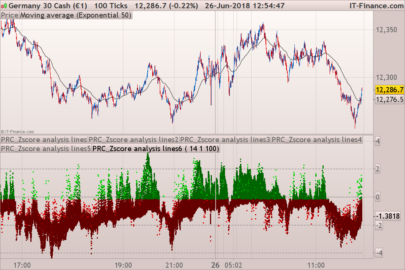
Mean Line
This line acts as the core of the indicator and represents the average price over a defined period. It is calculated using different methods (EMA, SMA, Gaussian, among others), which the user can select according to their needs.
- Significance: The mean line serves as the reference point from which price deviations are evaluated. A price above this line may indicate overbought conditions, while a price below it may suggest oversold conditions.
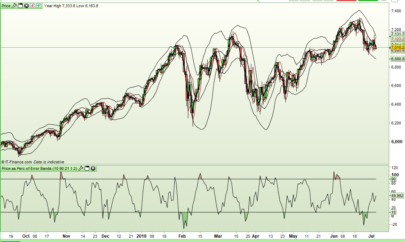
Channel Bands
The indicator defines two sets of bands:
- Inner bands: Closer to the mean line, showing minor deviations.
- Outer bands: Indicating more significant deviations, often considered high-probability reversion zones.
- Calculation: Bands are calculated by multiplying the average true range (ATR) by adjustable factors, allowing customization for different strategies and markets.
Gradient Zones
These zones are designed to show the market’s intensity. They use colors and transparencies to differentiate:
- Extreme levels within the channel.
- Intensity of buying or selling pressure.
4. Configuration and Customization of the Indicator
The MRI is highly customizable, making it a flexible tool for various trading styles. Some of the most important parameters are:
- Period Length (length): Defines the number of bars used to calculate the mean. A shorter period creates a more sensitive indicator, while a longer period smooths out fluctuations.
- Mean Type (type): Allows selection of different calculation methods like EMA, SMA, or Gaussian.
- Channel Multipliers (innermult and outermult): Adjust the distance of the inner and outer bands from the mean line.
- Gradient Zones (gradsize and zonetransp): Configure the intensity and transparency of the colors within the channel zones.
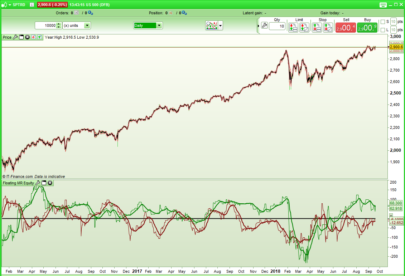
Example configuration for highly volatile markets:
- Period: 100 bars.
- Multipliers: 1 for the inner bands and 2.5 for the outer bands.
- Zones: Gradient of 0.5 and 60% transparency.
5. How to Interpret the Indicator
The MRI generates signals based on the interaction of price with the bands and the mean line:
Buy Signals
- Lower Inner Zone: When the price touches or crosses the lower inner band, it may signal a buying opportunity if a reversion toward the mean is expected.
- Lower Outer Zone: If the price touches the lower outer band, it indicates an even higher probability of reversion, ideal for more aggressive entries.
Sell Signals
- Upper Inner Zone: When the price reaches or crosses the upper inner band, it may signal a selling opportunity.
- Upper Outer Zone: Reaching the upper outer band confirms an extreme overbought condition.
Gradient Zones
The channel’s colors and transparencies help assess the strength of signals:
- Darker tones indicate levels closer to the mean, suggesting a lower probability of reversion.
- Lighter tones indicate extreme levels, where reversion probabilities are higher.
6. Advantages and Limitations
Advantages
- Versatility: Works well in volatile and sideways markets.
- Visually Intuitive: Colored zones make it easy to identify opportunities quickly.
- Adaptability: Adjustable parameters allow customization for different assets and trading styles.
Limitations
- Not Foolproof: Like any indicator, it may generate false signals, especially in strongly trending markets.
- Requires Confirmation: It is recommended to use it alongside other indicators or technical analysis tools to improve signal accuracy.
7. Conclusion
The Mean Reversion Channel (MRI) is a powerful tool for identifying overbought and oversold zones in various markets. Its visual design and flexibility make it an ideal resource for traders looking to operate under mean reversion conditions. However, it’s important to remember that no indicator is perfect, and its effectiveness increases when combined with additional analysis.
We encourage users to experiment with the MRI’s parameters to tailor it to their specific needs and maximize its utility in technical analysis.
|
1 2 3 4 5 6 7 8 9 10 11 12 13 14 15 16 17 18 19 20 21 22 23 24 25 26 27 28 29 30 31 32 33 34 35 36 37 38 39 40 41 42 43 44 45 46 47 48 49 50 51 52 53 54 55 56 57 58 59 60 61 62 63 64 65 66 67 68 69 70 71 72 73 74 75 76 77 78 79 80 81 82 83 84 85 86 87 88 89 90 91 92 93 94 95 96 97 98 99 100 101 102 103 104 105 106 107 108 109 110 111 112 113 114 115 116 117 118 119 120 121 122 123 124 125 126 127 128 129 130 131 132 133 134 135 136 137 138 139 140 141 142 143 144 145 146 147 148 149 150 151 152 153 154 155 156 157 158 159 160 161 162 163 164 165 166 167 168 169 170 171 172 173 174 175 176 177 178 179 180 181 182 183 184 185 186 187 188 189 190 191 192 193 194 195 196 197 198 199 200 201 202 203 204 205 206 207 208 209 210 211 212 213 214 215 216 217 218 219 220 |
//----------------------------------------// //PRC_Mean reversion channel MRI //version = 0 //21.11.24 //Iván González @ www.prorealcode.com //Sharing ProRealTime knowledge //----------------------------------------// // inputs //----------------------------------------// source=(high+close+low)/3 type=1 //1=SuperSmoother 2=Ehlers EMA 3=Gaussian 4=BandStop 5=SMA 6=EMA 7=RMA length=200 innermult=1 //inner Channel Multiplier outermult=2.415 //Outer Channel Multiplier drawchannel=1 displayzone=1 zonetransp=60 displayline=0 gradsize=0.5 pi=3.1416 mult=pi*innermult mult2=pi*outermult //----------------------------------------// //Aux Supersmoother //----------------------------------------// sa1=exp(-sqrt(2)*pi/length) sb1=2*sa1*cos(sqrt(2)*180/length) sc3=-pow(sa1,2) sc2=sb1 sc1=1-sc2-sc3 //----------------------------------------// //Aux SAK Supersmoother //----------------------------------------// cycl=2*180/length c0=1 c1=0 b0=1 b1=0 b2=0 a1=0 a2=0 alpha=0 beta=0 gamma=0 if type=2 then //Ehlers EMA alpha=(cos(cycl)+sin(cycl)-1)/cos(cycl) b0=alpha a1=1-alpha elsif type=3 then//Gaussian beta=2.415*(1-cos(cycl)) alpha=-beta+sqrt((beta*beta)+(2*beta)) c0=alpha*alpha a1=2*(1-alpha) a2=-(1-alpha)*(1-alpha) elsif type=4 then //Bandstop beta=2.415*(1-cos(cycl)) gamma=1/cos(cycl*2*0.1) alpha=gamma-sqrt(gamma*gamma-1) c0=(1+alpha)/2 b1=-2*beta b2=1 a1=beta*(1+alpha) a2=-alpha elsif type=5 then//SMA c1=1/length b0=1/length a1=1 elsif type=6 then//EMA alpha=2/(length+1) b0=alpha a1=1-alpha elsif type=7 then//RMA alpha=1/length b0=alpha a1=1-alpha endif //----------------------------------------// //Mean Reversion Channel //----------------------------------------// condition=0 //Mean Range if barindex<=3 then meanrange=sc1*tr+sc2*tr[1]+sc3*tr[2] else meanrange=sc1*tr+sc2*meanrange[1]+sc3*meanrange[2] endif //Mean Line if type=1 then if barindex<=3 then meanline=sc1*source+sc2*source[1]+sc3*source[2] else meanline=sc1*source+sc2*meanline[1]+sc3*meanline[2] endif else if barindex<=length then meanline=source else meanline=(c0*((b0*source)+(b1*source[1]))+b2*source[2])+a1*meanline[1]+a2*meanline[2]-c1*source[length] endif endif //Upper and lower bands if drawchannel and barindex>length then mymeanline=meanline upband1=meanline+meanrange*mult loband1=meanline-meanrange*mult upband2=meanline+meanrange*mult2 loband2=meanline-meanrange*mult2 else mymeanline=undefined upband1=undefined loband1=undefined upband2=undefined loband2=undefined endif //check condition if close > mymeanline then upband21=upband2+meanrange*gradsize*4 upband29=upband2-meanrange*gradsize*4 if high>=upband29 and high<upband2 then condition=1 elsif high>=upband2 and high<upband21 then condition=2 elsif high>=upband21 then condition=3 elsif close<=mymeanline+meanrange then condition=4 else condition=5 endif elsif close < mymeanline then loband21=loband2-meanrange*gradsize*4 loband29=loband2+meanrange*gradsize*4 if low<=loband29 and low>loband2 then condition=-1 elsif low<=loband2 and low>loband21 then condition=-2 elsif low<=loband21 then condition=-3 elsif close>=mymeanline+meanrange then condition=-4 else condition=-5 endif endif //----------------------------------------// //Draw channels //----------------------------------------// if displayzone and barindex>length then //Upper channel upband21=upband2+meanrange*gradsize*4 upband22=upband2+meanrange*gradsize*3 upband23=upband2+meanrange*gradsize*2 upband24=upband2+meanrange*gradsize*1 upband25=upband2+meanrange*gradsize*0 upband26=upband2-meanrange*gradsize*1 upband27=upband2-meanrange*gradsize*2 upband28=upband2-meanrange*gradsize*3 upband29=upband2-meanrange*gradsize*4 //Lower channel loband21=loband2-meanrange*gradsize*4 loband22=loband2-meanrange*gradsize*3 loband23=loband2-meanrange*gradsize*2 loband24=loband2-meanrange*gradsize*1 loband25=loband2-meanrange*gradsize*0 loband26=loband2+meanrange*gradsize*1 loband27=loband2+meanrange*gradsize*2 loband28=loband2+meanrange*gradsize*3 loband29=loband2+meanrange*gradsize*4 colorbetween(upband21,upband22,255,0,0,zonetransp) colorbetween(upband22,upband23,255,66,0,zonetransp) colorbetween(upband23,upband24,255,93,0,zonetransp) colorbetween(upband24,upband25,255,116,0,zonetransp) colorbetween(upband25,upband26,255,151,0,zonetransp) colorbetween(upband26,upband27,255,174,0,zonetransp) colorbetween(upband27,upband28,255,197,0,zonetransp) colorbetween(upband28,upband29,255,205,0,zonetransp) colorbetween(loband21,loband22,255,0,0,zonetransp) colorbetween(loband22,loband23,255,66,0,zonetransp) colorbetween(loband23,loband24,255,93,0,zonetransp) colorbetween(loband24,loband25,255,116,0,zonetransp) colorbetween(loband25,loband26,255,151,0,zonetransp) colorbetween(loband26,loband27,255,174,0,zonetransp) colorbetween(loband27,loband28,255,197,0,zonetransp) colorbetween(loband28,loband29,255,205,0,zonetransp) else //Upper channel upband21=undefined upband22=undefined upband23=undefined upband24=undefined upband25=undefined upband26=undefined upband27=undefined upband28=undefined upband29=undefined //Lower channel loband21=undefined loband22=undefined loband23=undefined loband24=undefined loband25=undefined loband26=undefined loband27=undefined loband28=undefined loband29=undefined endif //----------------------------------------// //Draw channels //----------------------------------------// if islastbarupdate and displayline then drawsegment(barindex,upband1,barindex+20,upband1)coloured("green") drawsegment(barindex,loband1,barindex+20,loband1)coloured("green") drawsegment(barindex,upband2,barindex+20,upband2)coloured("red") drawsegment(barindex,loband2,barindex+20,loband2)coloured("red") endif //----------------------------------------// return mymeanline as "Mean" coloured("orange")style(line,2),upband1 as "R1" coloured("green")style(point),loband1 as "S1"coloured("green")style(point),upband2 as "R2"coloured("red"),loband2 as "S2" coloured("red") |
Share this
No information on this site is investment advice or a solicitation to buy or sell any financial instrument. Past performance is not indicative of future results. Trading may expose you to risk of loss greater than your deposits and is only suitable for experienced investors who have sufficient financial means to bear such risk.
ProRealTime ITF files and other attachments :
Find other exclusive trading pro-tools on ![]()
PRC is also on YouTube, subscribe to our channel for exclusive content and tutorials


Don Iván, en primer lugar mostrar mi gratitud, por compartir su conocimiento; es un hecho que, incrementa el conocimiento de un colectivo.
Tras ello afirmar que, este indicador es muy útil y (de momento), no he hallado grandes dificultades para su parametrización ya que los pará-
metros predefinidos son bastante coherentes, al menos en los gráficos en los que lo he testeado.
Gracias… gracias… gracias…
Well programmed, but in my eyes ‘only’ better Bollinger Bands with all their quirks and false signals.
Please create a strategy on the S&P500 and prove that the indicator is useful………
lg
Ja, das würde mich auch interessieren
Me uno al comentario de Edelmiro. Un millón de gracias por el trabajo constante, dándonos indicadores nuevos todas las semanas. Una labor inconmensurable y que merece todo el reconocimiento. Por cierto magnífico este último indicador.
ciao,complimenti .SIispira ai canali di migliorino per caso?grazie