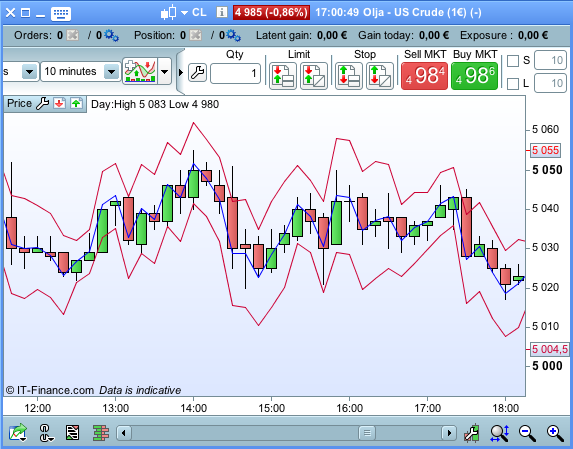
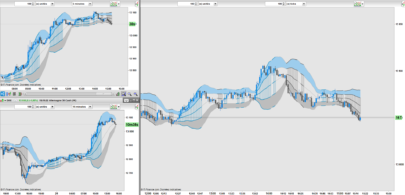
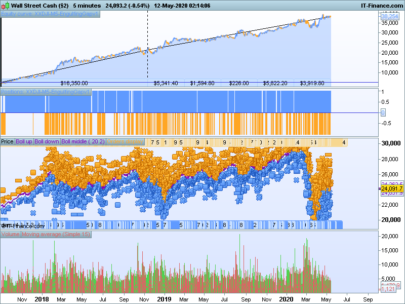
I found an interesting article by Thomas Stridsman on a variation of bollinger bands for short-term trading. He is addressing 3 problems of the usual bollinger bands.
1.) For calculating the standard deviation one needs at least 20 (some source even say 30) occurrences. This makes it difficult to use bollinger bands on a SMA with lower periods like one would favor for shortchanged-term trading.
2.) Standard bollingerbands only utilize the closing price and ignore everything else.
3.) Standard Bollinger bands address the changes in price in points, meander bands use the daily change in percentage and give so more comparable results.
The original code is for Tradestation which allows the use of arrays. We don’t have this option with PRT so my code became a little ugly. This is also the reason why it is not possible to change the lookback. It is now fixed to 5 bars lookback and has to be adapted manually in the code if you want to change that.
|
1 2 3 4 5 6 7 8 9 10 11 12 13 14 15 16 17 18 19 20 21 22 23 24 25 26 27 28 29 30 31 32 33 34 35 36 37 38 39 40 |
//Settings : //Deviation = 2 bar1Open=(Open-close[1])/close[1] bar1High=(High-close[1])/close[1] bar1Low=(Low-close[1])/close[1] bar1Close=(Close-close[1])/close[1] bar2Open=(Open[1]-close[2])/close[2] bar2High=(High[1]-close[2])/close[2] bar2Low=(Low[1]-close[2])/close[2] bar2Close=(Close[1]-close[2])/close[2] bar3Open=(Open[2]-close[3])/close[3] bar3High=(High[2]-close[3])/close[3] bar3Low=(Low[2]-close[3])/close[3] bar3Close=(Close[2]-close[3])/close[3] bar4Open=(Open[3]-close[4])/close[4] bar4High=(High[3]-close[4])/close[4] bar4Low=(Low[3]-close[4])/close[4] bar4Close=(Close[3]-close[4])/close[4] bar5Open=(Open[4]-close[5])/close[5] bar5High=(High[4]-close[5])/close[5] bar5Low=(Low[4]-close[5])/close[5] bar5Close=(Close[4]-close[5])/close[5] //------------average price over the last 5 bars -------------------------- avg=(bar1Open+bar1High+bar1Low+bar1Close+bar2Open+bar2High+bar2Low+bar2Close+bar3Open+bar3High+bar3Low+bar3Close+bar4Open+bar4High+bar4Low+bar4Close+bar5Open+bar5High+bar5Low+bar5Close)/20 //-------------- calculation of standard deviation ------------------ var=(square(bar1Open-avg)+square(bar1High-avg)+square(bar1Low-avg)+square(bar1Close-avg)+square(bar2Open-avg)+square(bar2High-avg)+square(bar2Low-avg)+square(bar2Close-avg)+square(bar3Open-avg)+square(bar3High-avg)+square(bar3Low-avg)+square(bar3Close-avg)+square(bar4Open-avg)+square(bar4High-avg)+square(bar4Low-avg)+square(bar4Close-avg)+square(bar5Open-avg)+square(bar5High-avg)+square(bar5Low-avg)+square(bar5Close-avg))/20 stdev=SQRT(var) middle=close*(1+avg) meanderhigh=close*(1+avg+deviation*stdev) meanderlow=close*(1+avg-deviation*stdev) RETURN middle coloured (0,0,255) as "MeanderMiddle" , meanderhigh coloured (204,0,51) as "MeanderUp", meanderlow coloured (204,0,51) as "MeanderLow" |
Share this
No information on this site is investment advice or a solicitation to buy or sell any financial instrument. Past performance is not indicative of future results. Trading may expose you to risk of loss greater than your deposits and is only suitable for experienced investors who have sufficient financial means to bear such risk.
ProRealTime ITF files and other attachments :PRC is also on YouTube, subscribe to our channel for exclusive content and tutorials
