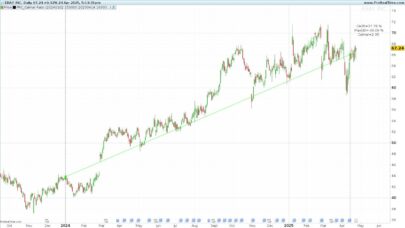
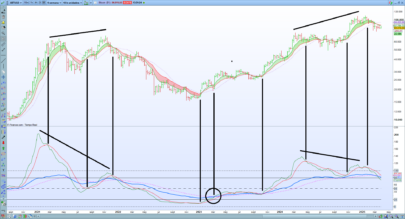
The indicator is an oscillator which highlights overbought and oversold conditions.This one kindla act like any other overbought and oversold indicator but this one is not bounded and give better reaction.
Deviation from the N average price is spotted when the oscillator gain much higher or lower than the overbought and oversold zones. Because any instrument has different deviations from their N average periods, this one could adapt much more because of multiplying by the square rooting of the periods N, the ATR denominator.
|
1 2 3 4 5 6 7 8 9 10 11 12 13 |
//parameters : <br /> //N = 14<br /> //hi = 0.5<br /> //lo = -0.5<br /> <br /> once result = close<br /> VC = average[N]((High+Low)/2)<br /> R = RANGE[1]<br /> <br /> ATR = average[N](R)<br /> Result = (Close - VC) / (ATR*SQRT(N))<br /> <br /> RETURN Result as "MCVI", 0 as "mid level", hi as "overbought level", lo as "oversold level" |
Share this
No information on this site is investment advice or a solicitation to buy or sell any financial instrument. Past performance is not indicative of future results. Trading may expose you to risk of loss greater than your deposits and is only suitable for experienced investors who have sufficient financial means to bear such risk.
ProRealTime ITF files and other attachments :PRC is also on YouTube, subscribe to our channel for exclusive content and tutorials


