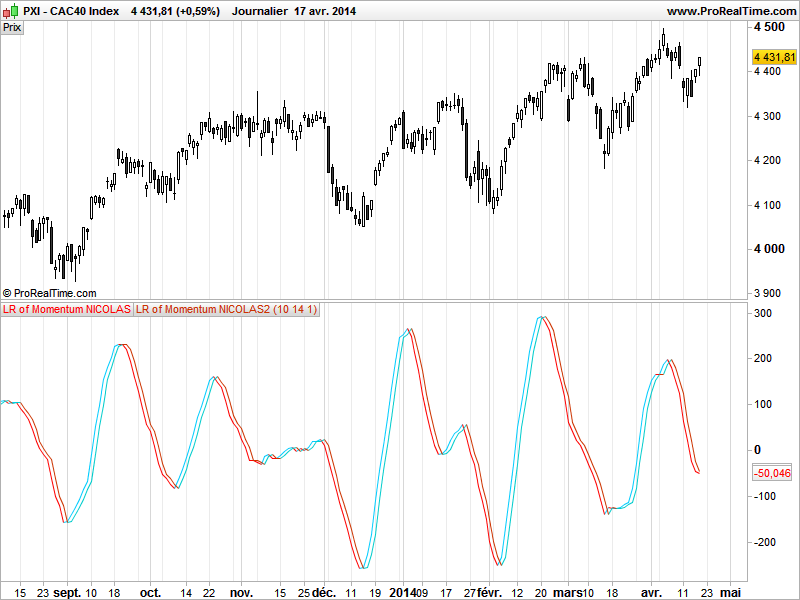
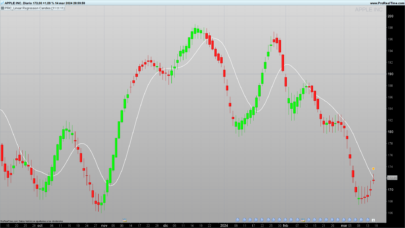
This is an indicator made of the linear regression applied to the rate of change of price (or momentum).
I made a simple signal line just by duplicating the first one within a period decay in the past, to make those 2 lines cross. You can add more periods decay to made signal smoother with less false entry.
|
1 2 3 4 5 6 7 8 9 10 |
//parameters : //MOM = 10 //LR = 14 //decay = 1 MOMENT = Momentum[MOM](Close) LRMOM = LinearRegression[LR](MOMENT) LRMOMDECAY = LRMOM[DECAY] RETURN LRMOM,LRMOMDECAY |
Share this
No information on this site is investment advice or a solicitation to buy or sell any financial instrument. Past performance is not indicative of future results. Trading may expose you to risk of loss greater than your deposits and is only suitable for experienced investors who have sufficient financial means to bear such risk.
ProRealTime ITF files and other attachments :PRC is also on YouTube, subscribe to our channel for exclusive content and tutorials




Really liking this indicator. Thanks
Moving your last response to this post. Thanks for conforming the code below. How does PRT/PRC code Momentum? Is it (C / CP) ?
Using the code above, LRMOM = LinearRegression [LR] (MOMENT) I get a volatile result. If I use
LRMOM = LinearRegression[LR] – (MOMENT) I get a smooth result.
Hence my question, please advise.
SB-FO • 17 hours ago #
Nicolas, can you share with me how PRT calculates LinearRegression ? Is it (3 * WeightedAverage Close X – 2 * AVERAGE Close X) X= Period?
avatar
Nicolas • 8 hours ago #
The above code is the way it is calculated in PRT. However the exact indicator can be found here: https://www.prorealcode.com/prorealtime-indicators/standard-deviation-standard-error-linear-regression-channel/
It is obtained by substracting the x days before Close from today’s Close. X is the parameter associated with Momentum.
https://www.prorealcode.com/documentation/momentum/