Monthly, Weekly and Daily Activity and Equity

v10.3
Monthly, Weekly and Daily Activity and Equity

This collection of nine simple indicators is a further development of my indicator found here:

https://www.prorealcode.com/prorealtime-indicators/most-active-hours-and-months/

The first set of three indicators analyses the range to show any month/week/day of week that has historically had higher or lower than average range.

The second set analyses the volume to show any month/week/day of week that has historically had higher or lower than average volume.

The third set analyses the equity gain or loss to show any month/week/day of week that has historically had higher than average positive or negative equity.

Each indicator must be applied to the relevant time frame chart – so monthly on monthly, weekly on weekly and daily on daily.

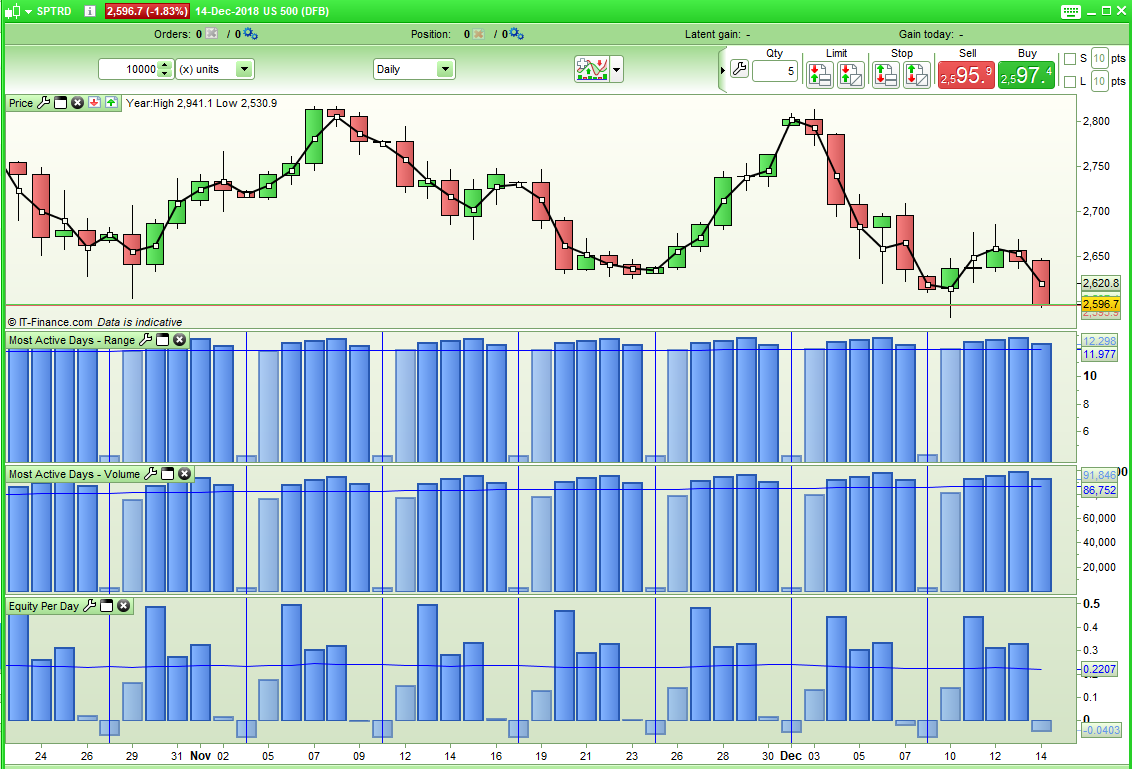
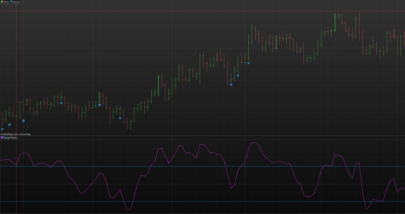
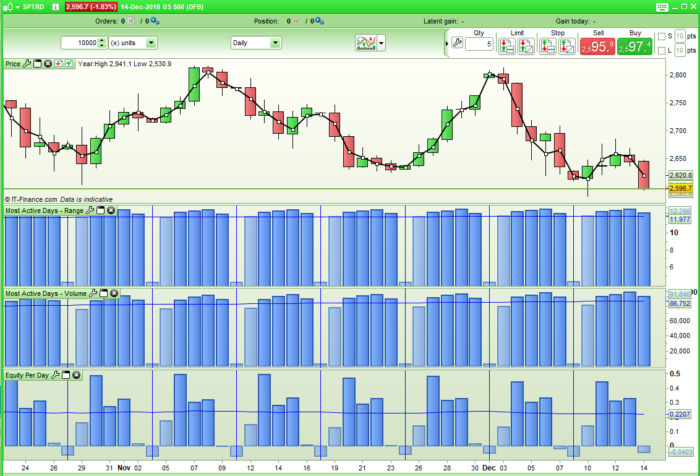
In the attached image it can clearly be seen that on the SP500 Tuesday, Wednesday and Thursday have been good days to go long and that Tuesday, Wednesday, Thursday and Friday have had above average volume and above average range, Mondays have been quieter.

We do have to consider that the Sunday candle is based on a shorter day and that there has not always been a Sunday candle in all of the historical data.

In the weekly analysis we have to take into consideration that PRT has no way to tell us what week of the year it is so I have started counting from the moment a new year is detected. Not all years have 52 x 6 trading days in them so this can lead to some years having 53 weeks. So the data around the start of a new year can be a little difficult and shorter weeks than the 6 trading days may be used leading to inaccurate returns by the indicator for those weeks either side of a new year’s start.

Also bear in mind that volume information is not available for all instruments and has only been available in PRT for recent history.

Share this

Risk disclosure:

No information on this site is investment advice or a solicitation to buy or sell any financial instrument. Past performance is not indicative of future results. Trading may expose you to risk of loss greater than your deposits and is only suitable for experienced investors who have sufficient financial means to bear such risk.

ProRealTime ITF files and other attachments : How to import ITF files into ProRealTime platform?

PRC is also on YouTube, subscribe to our channel for exclusive content and tutorials
avatar
Register or

Likes

avatar avatar avatar avatar avatar avatar avatar
Related users ' posts
YvesRobert Hello David, can you explain to me this strategy ? You calculate the difference between t...
davidelaferla The strategy calculates the variation between the body and the previous body (however in pro...
KumoNoJuzza Thanks David it looks great. I am playing with it to get familiar. Do you think it would b...
BaderBader Good day davidelaferla, Thank you for making your strategy available to the community, I do...
NEOMKEY Magnífico !!!. Al menos para mí. Gran trabajo con tus aportes Iván. Mira a ver si le incluye...
Iván jajaja gracias :)
oliTR Very good Iván ! However what would be the modification to add to the code in order to dis...
larouedegann TIMEFRAME(15minutes) apparemment ne fonctionne pas
Iván Bonjour Je ne comprends pas bien le problème. L'indicateur fonctionne dans n'importe quelle...
larouedegann OUI je le sais, il fonctionne dans toutes les unités de temps. Mais je souhaite utiliser l'i...
Iván
10 months ago
Iván I personally like it in daily timeframe
oliTR Many thanks Ivan, I copy/paste your code to try it but could only get a constant stable unif...
Iván Hi, I've copied the code above and it works... what asset are you trying? $indices array ...
Razz Bonjour Je pense que votre indicateur est très bon. Serait-il possible d'afficher la heatma...
philippe59139 if marketEtHeamap=1 then drawtext("#touch#",barindex+10,checkprice,SansSerif,Standard,10) c...
philippe59139 voici pour toi RAZZ il te faut simplement ajouter les drawtext https://www.prorealcode.com...
finplus Bonjour, une petite demande concernant cet indicateur : comment faire pour que lorsque la bo...
LucasBest Bonjour, la coloration des bandes se fait ligne 111 et 112 à l'aide des instructions colorbe...
YvesRobert Hello davidelaferla, how do you put a stop loss and where exactly ? the moment you enter on ...
Hypersimo Buongiorno Davide a quale distanza inserire stop loss e tp nella strategia? grazie
beanpole Thank you for sharing the code. I applied it to the "CAC40 Index" on Euronext market on a da...
JS
1 year ago
steffen_burat Hello Nicolas, I have a cumulative histogram update problem, the indicator often updates ...
taklause Hello Nicolas, if I try to use your indicator in a trading system, the error on prc pops up ...
Gio56 Bonjour Nicolas J'ai le meme souci que steffen , l'indicateur ne cumule qu'après avoir redé...
YvesRobert Bonjour Nicolas, en effet ca marche, je me suis trompé, j'ai bien tout le tracé. C'est parce...
oliTR Bonjour, les conditions longCond et shortCond ne contiennent-elles pas une condition qui s'a...
xpe74 Utilitaire vraiment top, d'autant qu'ajouter des filtres de seuil peux aider a limiter le no...
Rafa Hi Nicolas! I can´t install this indicator. it installs in a separate window not as an av...
Nicolas Add it on the price, see how: https://www.prorealcode.com/blog/video-tutorials/how-to-add-an...
Frankyslo1 No consigo instalarlo en el precio en PRL-version 10
Khaled As this section of the forum is in English, I'll reply in English. I'm using PRT v11, so I d...
sal157011 Don't understand where it says: "Volume Pressure Histogram: Columns plotted in positive are ...
Khaled Not sure to understand the question. However, the columns (Histogram) represent the variable...
Jiacky
2 years ago
Range Factor
Range Factor
0
Indicators
Alai-n Cela fonctionne très bien !!! Super Merci
andreabarbuscia Ciao Nicolas, molto bello questo indicatore, l'ho apprezzato molto. Lo sto testando insieme...
Alai-n Je poste ici un lien afin de mieux appréhender le CVD-Cumulative Volume Delta : https://www....
Nicolas
3 years ago
DELBERT Bonsoir , Nicolas , j'ai transféré votre indicateur sur ma PRT 10,3 et j'ai un méssage d'ére...
Nicolas Vous pouvez essayer en remplacant la ligne avec: vwapsd = sqrt(average[lengthz](square(clo...
DELBERT Bonsoir , merci Nicolas , a bientôt .
Sever
3 years ago

Top