Monthly, Weekly and Daily Activity and Equity

v10.3
Monthly, Weekly and Daily Activity and Equity

This collection of nine simple indicators is a further development of my indicator found here:

https://www.prorealcode.com/prorealtime-indicators/most-active-hours-and-months/

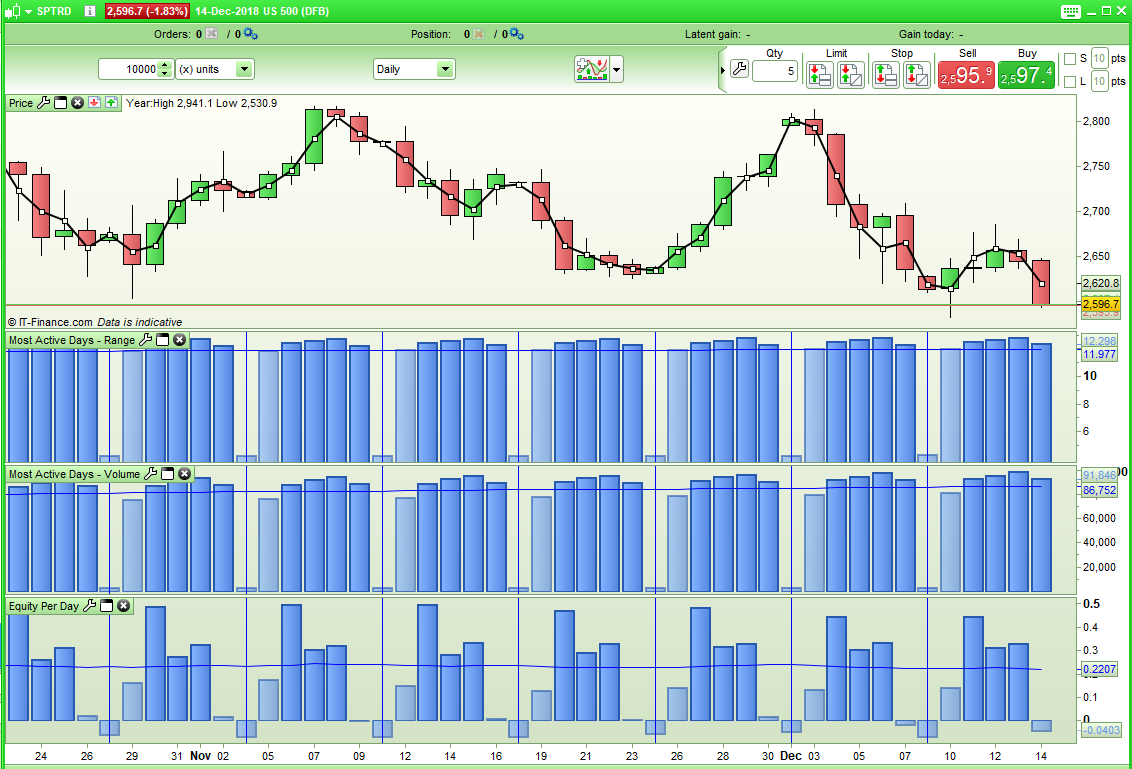
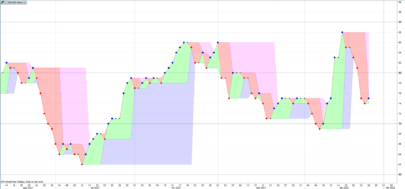
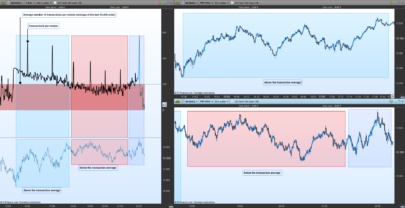
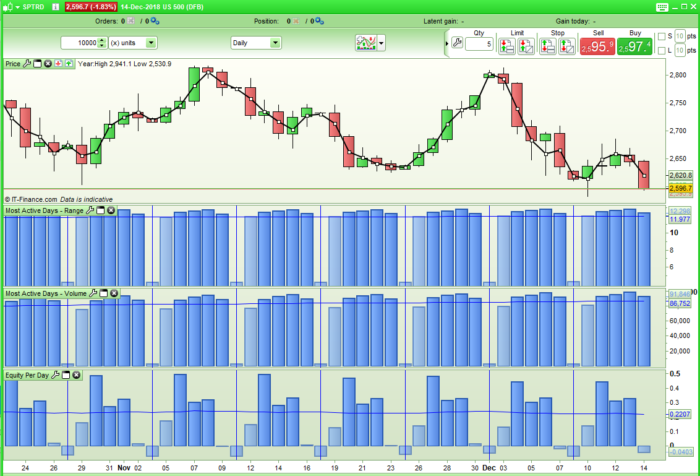
The first set of three indicators analyses the range to show any month/week/day of week that has historically had higher or lower than average range.

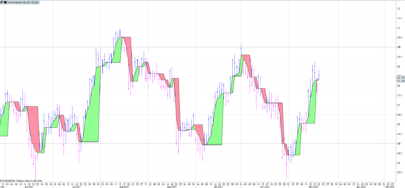
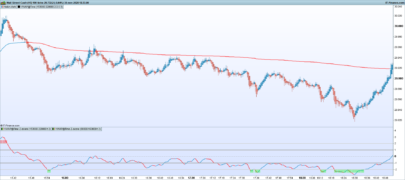
The second set analyses the volume to show any month/week/day of week that has historically had higher or lower than average volume.

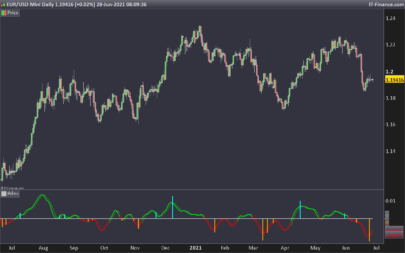
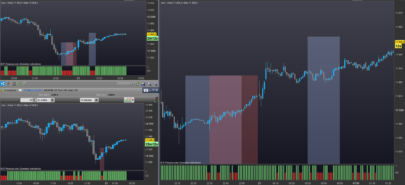
The third set analyses the equity gain or loss to show any month/week/day of week that has historically had higher than average positive or negative equity.

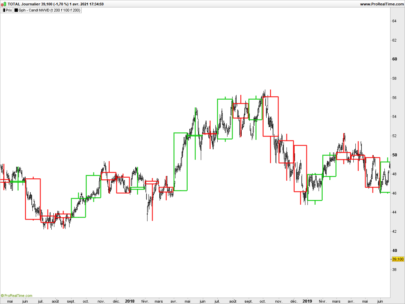
Each indicator must be applied to the relevant time frame chart – so monthly on monthly, weekly on weekly and daily on daily.

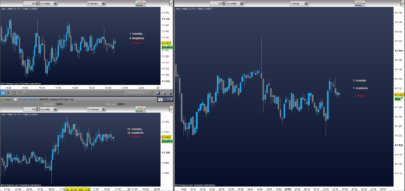
In the attached image it can clearly be seen that on the SP500 Tuesday, Wednesday and Thursday have been good days to go long and that Tuesday, Wednesday, Thursday and Friday have had above average volume and above average range, Mondays have been quieter.

We do have to consider that the Sunday candle is based on a shorter day and that there has not always been a Sunday candle in all of the historical data.

In the weekly analysis we have to take into consideration that PRT has no way to tell us what week of the year it is so I have started counting from the moment a new year is detected. Not all years have 52 x 6 trading days in them so this can lead to some years having 53 weeks. So the data around the start of a new year can be a little difficult and shorter weeks than the 6 trading days may be used leading to inaccurate returns by the indicator for those weeks either side of a new year’s start.

Also bear in mind that volume information is not available for all instruments and has only been available in PRT for recent history.

Share this

Risk disclosure:

No information on this site is investment advice or a solicitation to buy or sell any financial instrument. Past performance is not indicative of future results. Trading may expose you to risk of loss greater than your deposits and is only suitable for experienced investors who have sufficient financial means to bear such risk.

ProRealTime ITF files and other attachments : How to import ITF files into ProRealTime platform?

PRC is also on YouTube, subscribe to our channel for exclusive content and tutorials

avatar
Register or

Likes

avatar avatar avatar avatar avatar avatar avatar
Related users ' posts
Nicolas
3 years ago
DELBERT Bonsoir , Nicolas , j'ai transféré votre indicateur sur ma PRT 10,3 et j'ai un méssage d'ére...
Nicolas Vous pouvez essayer en remplacant la ligne avec: vwapsd = sqrt(average[lengthz](square(clo...
DELBERT Bonsoir , merci Nicolas , a bientôt .
Sever
3 years ago
Stenozar Hi Sever, how can I visualize the coloured areas?
Sever Hi Stenozar, You need to add the color zones yourself , just go to Add Color Zone To set ...
ChemaGeek Bonjour Nicolas, j'ai récemment découvert cet indicateur (Regularized Momentum 2017) et je l...
YvesRobert Bonjour, nouveau sur PRT (qq jours), j'essaie un peu de voir quel type d'indicateur me convi...
Boris Hi IVMcm, thanks for your amazing work. I have tested all of your indicators and use some of...
IV Mcm With pleasure and thanks!
ashiash how to use this indicator can i use tradingview platform
Paris On est bien d accord que l indicateur repeint ....
Nicolas naturellement si la bougie du timeframe supérieur n'est pas terminé
ThePenntChemist Does this show 5min time frame?
Ichimoku Reading I don't know in this case, I just downloaded it again and no problem for me. Try to downloa...
Ichimoku Reading What's the error that appears ?
Suzu Yuk Yes, it worked with 1Tick with 200 K . Thank you very much.
Monobrow Hi Daniele Thank you for the indicator, it looks very good. However, I have a problem so...
avatar
Anonymous Thanks very much for sharing, look forward to testing this idea out.
mathiasKN Thank you Daniele for making this script, I know its been some time since the release but wo...
Seabiscuit Hi! I like this indicator a lot, been using it on a 30 min timeframe and usually confirms my...
Ramahu Bonjour et merci pour cet indicateur ! je l'observe sur les actions du Nasdaq et la plupart ...
Barrabas15 Apparently, according to the attached data, there is an error in the indicator code. Attach...
Barrabas15 The files are at the end of the following link: https://www.prorealcode.com/topic/time-seg...
robertogozzi Thank you Barrabas15, the correct code is at https://www.prorealcode.com/topic/time-segmente...
IV Mcm Line 68 and 70, you must delete the instruction at the end of the line "" Bordercolor(0,0,0,...
BoutDePain This instruction is for the V11 maybe that you are using V10.3 then you can safely remove it.
Protagonist Bonjour, Je vois l'instruction inRange mais je ne trouve pas sa signification. Pouvez-vous...
Nicolas
5 years ago
Nicolas La définition des couleurs se situent entre les lignes 94 et 118. Selon le type de bougie (h...
Manu35250 Bonjour Nicolas, Est il possible de convertir cet indicateur en screener ? J'essaie depui...
Nicolas Bien sûr, merci de formuler la demande dans le forum approprié en respectant les règles de p...
PHAN100 bonjour, bravo à l'auteur pour cet indicateur visuel sur le graphique, il nous reste à va...
Nicolas esta possible
bolsatonimora2 Hola Nicolas, perdona la molestia, pero podrias codificar el screener para rupturas de sopor...
Nicolas Utilice los foros para solicitar una codificación personalizada.
GARNIEPI hello I am looking for an anchored vwap intraday, indicator which allows you to visualize th...
withoutwings To be able to flexibly wrap around the full 24h (i.e. past midnight), or to use just a singl...
yeoreum Thank you very much for the screener, it reminds me on Minervini VCP. How to change th...
reecet any codes like this but in minutes and hours rather than days?
PHAN100 bonjour, je viens de tester ce screener, je constate une anomalie...il ne renvoie pas l'e...

Top