Monthly, Weekly and Daily Activity and Equity

v10.3
Monthly, Weekly and Daily Activity and Equity

This collection of nine simple indicators is a further development of my indicator found here:

https://www.prorealcode.com/prorealtime-indicators/most-active-hours-and-months/

The first set of three indicators analyses the range to show any month/week/day of week that has historically had higher or lower than average range.

The second set analyses the volume to show any month/week/day of week that has historically had higher or lower than average volume.

The third set analyses the equity gain or loss to show any month/week/day of week that has historically had higher than average positive or negative equity.

Each indicator must be applied to the relevant time frame chart – so monthly on monthly, weekly on weekly and daily on daily.

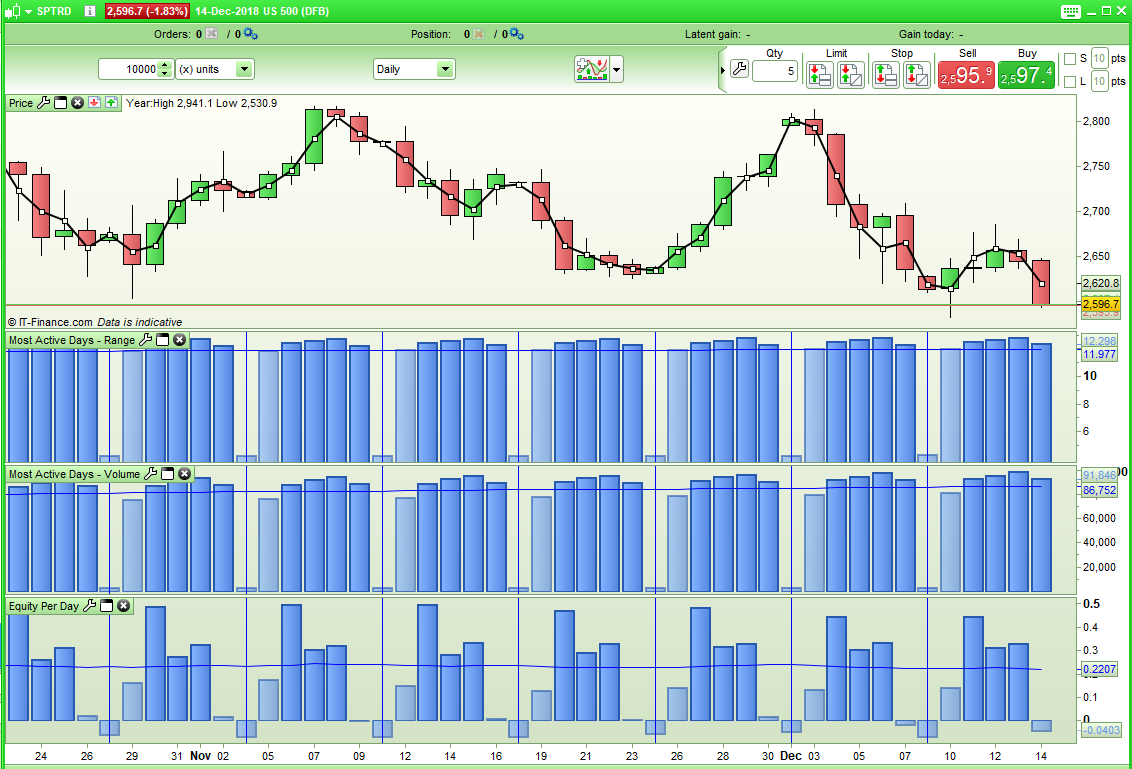
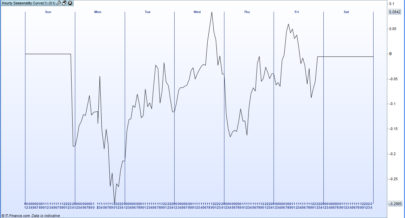
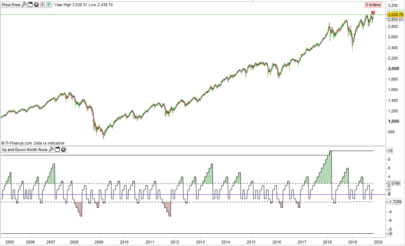
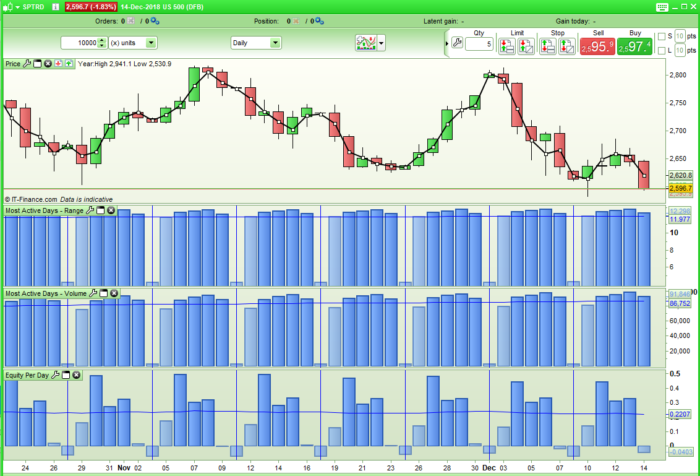
In the attached image it can clearly be seen that on the SP500 Tuesday, Wednesday and Thursday have been good days to go long and that Tuesday, Wednesday, Thursday and Friday have had above average volume and above average range, Mondays have been quieter.

We do have to consider that the Sunday candle is based on a shorter day and that there has not always been a Sunday candle in all of the historical data.

In the weekly analysis we have to take into consideration that PRT has no way to tell us what week of the year it is so I have started counting from the moment a new year is detected. Not all years have 52 x 6 trading days in them so this can lead to some years having 53 weeks. So the data around the start of a new year can be a little difficult and shorter weeks than the 6 trading days may be used leading to inaccurate returns by the indicator for those weeks either side of a new year’s start.

Also bear in mind that volume information is not available for all instruments and has only been available in PRT for recent history.

Share this

Risk disclosure:

No information on this site is investment advice or a solicitation to buy or sell any financial instrument. Past performance is not indicative of future results. Trading may expose you to risk of loss greater than your deposits and is only suitable for experienced investors who have sufficient financial means to bear such risk.

ProRealTime ITF files and other attachments : How to import ITF files into ProRealTime platform?

PRC is also on YouTube, subscribe to our channel for exclusive content and tutorials
avatar
Register or

Likes

avatar avatar avatar avatar avatar avatar avatar
Related users ' posts
jaginho Bonjour Vivien, je n'arrive pas à comprendre ce screener... En tout cas merci pour tes contr...
avatar
Anonymous Superb, merci!
oliverkeim Hi, also here not working. Only white lines.
killerplatuze Dont work anymore with the current version?
KryptoKat tolle Arbeit, professionell
Bard Hi @Vonasi, this is an excellent tool! I noticed you times by 180 and was wondering why? W...
Bard I have no idea what is wrong with the posting on this website. I have problems editing posts...
Bard And now my first post displays okay? It literally had copies of my orig post all added toget...
Nicolas Ask on an Excel website?!
JJMR HOLA NICOLAS, TENGO LA ULTIMA VERSION ACTUALIZADA DEL INDICADOR TTM SQUEEZE PRO EN LA VERSIO...
imokdesign @nicolas ,if in want to "call" this indicator, which values i have to write down?
Screw27 Salut nicolas j'aimerais savoir tes résulats grace a cettte methode
eva.g.forsgren It dose not work, I get a strap instead of candels???????????????????????????????????????????
Nicolas That indicator is the one below the chart. The indicator to put on the price chart is this o...
pyhrus P.S : IG , que j'ai contacté ,m'indique que la version V11 , ne sera pas disponible avant un...
Hasardeur Dear Nicolas, is there someting at the arry to modify in order to run the trend at the actu...
MALIMALO Dear Nicolas, just try touse your indicator with backtest but it's not working. is anybody...
Vonasi Sorry - I'm not coding anything at the moment.
IG_CFD_Trader Hi Vonassi, Your coding skills in PRT are amazing. Keep up the great contributions. I have...
jmf125 Any reason why this indicator would have stopped working. Tried to run it on v11 and v12 but...
Vinks_o_7 Vonasi you're a beast !!! ;-)))
pableitor Amazing indicator , you are pushing PRT to the limit! But looking at the scatter its not c...
JohnScher I've been looking for this for a long time! A very big thank you to you.
Nupsator hi, looks very interesting, i imported the indicator and inserted it into a 1h chart. Unfort...
Ciccarelli Franco Lo trovo interessante, ma non riesco a scaricarlo. Chi mi può aiutare?
ipbvba idem ne fonctionne pas sur V11 (meme avec real time data), import OK mais aucune courbe dans...
Ciccarelli Franco I'm new to the Market, I imported the code, but I don't see anything, there is an empty box ...
tradermikey Is the available for v12?
1Randy I would be interested an invite to your blog. I am still learning about the VSA and it looks...
repropel Buenos días TACBOLSA. Yo también estoy interesado en visitar tu blog. Podrías enviarme una i...
mobychix Hi, I just joined Pro Realtime and am very interested in VSA. I have read some books and did...
Maxime Baudin Very useful! Thanks Mat, and Happy New Year
nicko Great work. Thank you. However I am having trouble getting it to print in the first bar. If ...
Vonasi
5 years ago
Maxime Baudin Very interesting for monthly stock market strategies, thank you Vonasi! :)
Marie-Eve Vergoz Bonsoir - Voici l'erreur qui est signalée lorsque je souhaite utiliser cet indicateur : il...
Meta Signals Pro Pleasure ! Please let us know if you make good trades with it and if you see improvements we...
francis59 Bonjour, Bonjour, comment puis-je créer un screener basé sur cet indicateur, qui affiche le...
Trader Sab I am curious to try it how, however I get an error message for line 47 and 48 - drawsegment,...

Top