Monthly, Weekly and Daily Activity and Equity

v10.3
Monthly, Weekly and Daily Activity and Equity

This collection of nine simple indicators is a further development of my indicator found here:

https://www.prorealcode.com/prorealtime-indicators/most-active-hours-and-months/

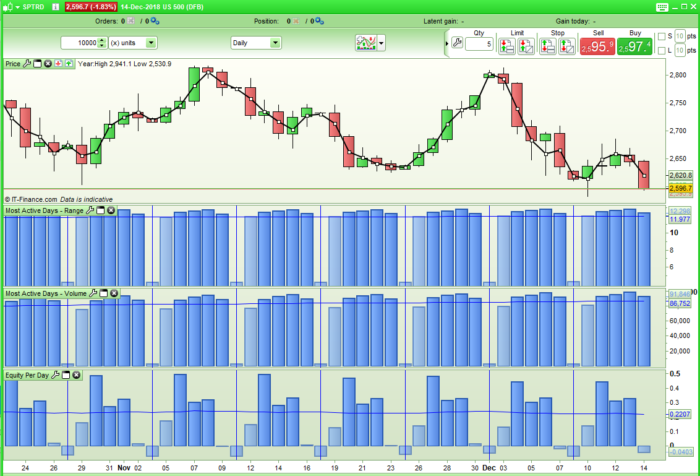
The first set of three indicators analyses the range to show any month/week/day of week that has historically had higher or lower than average range.

The second set analyses the volume to show any month/week/day of week that has historically had higher or lower than average volume.

The third set analyses the equity gain or loss to show any month/week/day of week that has historically had higher than average positive or negative equity.

Each indicator must be applied to the relevant time frame chart – so monthly on monthly, weekly on weekly and daily on daily.

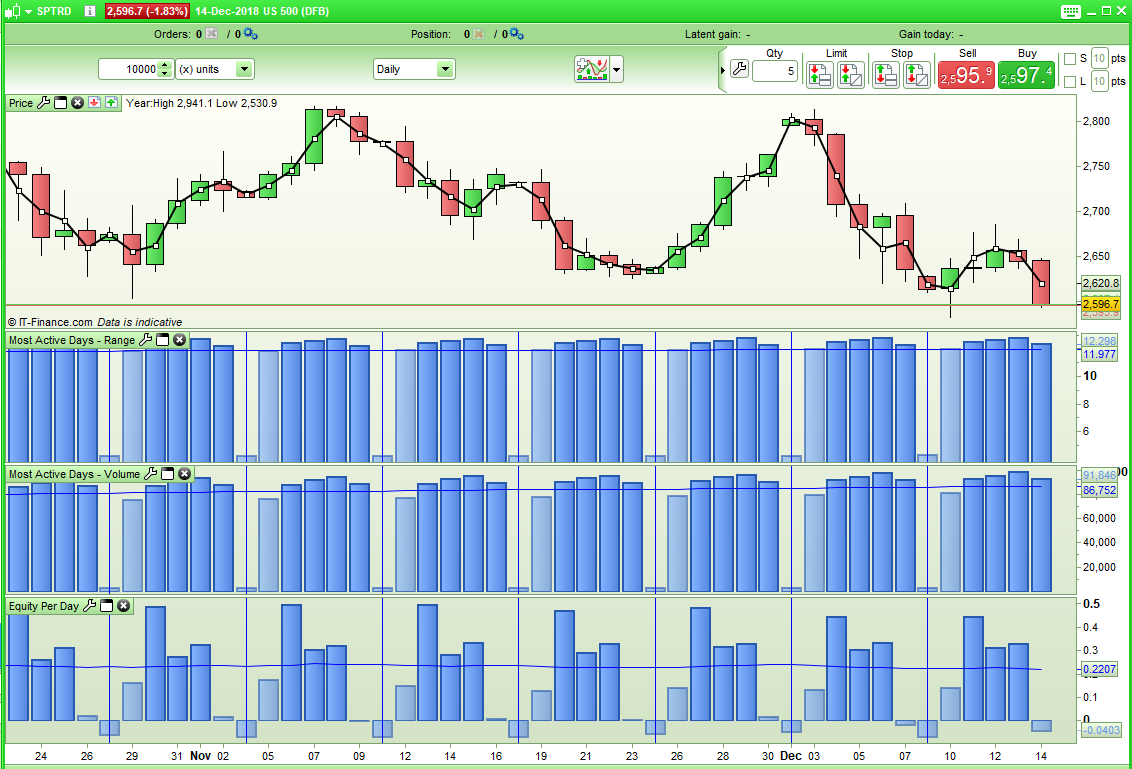
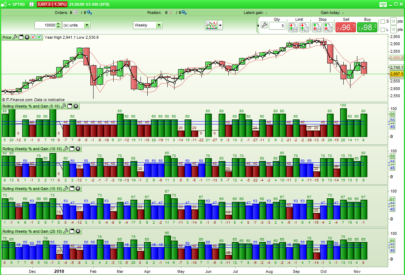
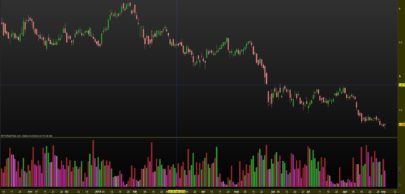
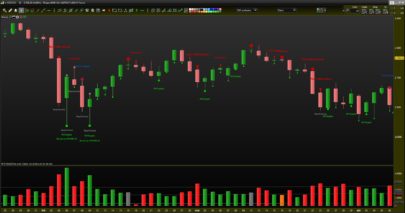
In the attached image it can clearly be seen that on the SP500 Tuesday, Wednesday and Thursday have been good days to go long and that Tuesday, Wednesday, Thursday and Friday have had above average volume and above average range, Mondays have been quieter.

We do have to consider that the Sunday candle is based on a shorter day and that there has not always been a Sunday candle in all of the historical data.

In the weekly analysis we have to take into consideration that PRT has no way to tell us what week of the year it is so I have started counting from the moment a new year is detected. Not all years have 52 x 6 trading days in them so this can lead to some years having 53 weeks. So the data around the start of a new year can be a little difficult and shorter weeks than the 6 trading days may be used leading to inaccurate returns by the indicator for those weeks either side of a new year’s start.

Also bear in mind that volume information is not available for all instruments and has only been available in PRT for recent history.

Share this

Risk disclosure:

No information on this site is investment advice or a solicitation to buy or sell any financial instrument. Past performance is not indicative of future results. Trading may expose you to risk of loss greater than your deposits and is only suitable for experienced investors who have sufficient financial means to bear such risk.

ProRealTime ITF files and other attachments : How to import ITF files into ProRealTime platform?

PRC is also on YouTube, subscribe to our channel for exclusive content and tutorials
avatar
Register or

Likes

avatar avatar avatar avatar avatar avatar avatar
Related users ' posts
Real Pro Great work gabri. I have this coded on Amibroker and I have done lots of backtesting but ne...
gabri Hi Real Pro, this indicator assists novices of the Wyckoff system. Wyckoff himself thought t...
tatie hi Gabri, I just came across the wyckoff method and was looking for the weiss wave indica...
Brisvegas Thats Awesome thank you
Vinks_o_7 Thanks Vonasi !
ALE Very Very Nice
manel Hi - Many thanks for this and your other analytical codes, stellar work - very useful ! With...
Vonasi Good idea Manel. I have posted a new version here that shows results as a percentage: https:...
Jesper Great share!
Vonasi No problem pableitor - I'm glad you like it.
pableitor Hi Vonasi, I was checking a few random weeks with your indicator and sometimes it seems to ...
Vonasi I have not checked your query on a chart but my guess is that you are reading the indicator ...
DanT01 Hi Nicolas, great work! Is it possible to contact you to help with a couple of indicators? T...
Nicolas Assistance is free on forums. For private job, you can contact me with the trading programmi...
avatar
Anonymous Thank you! I was reading the book Beyond Technical Analysis and wanted to try to coding RAV...
Juan Salas Hi FULVIO09, Nice piece of work. It seems to work very well. Does only work for INDEXES??...
Johann Hi @FULVI09, I understand the instructions however I'm not too sure how to determine the "p...
Player8520 Hello, It doesn't work with me either. However, I changed AA to 180 on line 15, added th...
eckaw Hi Nicolas, I'm using this indicator when there is confluence over 3 different timeframes (5...
Nicolas Yes it is indeed possible. Create a topic in the screener forum and explain what you need an...
KyleReed i've been using this for a few days now and it's really helped me a lot in timing the execut...
luxrun Thanks, bolsatrilera, for a very good and solid screener!
luxrun sorry... indicator!
Lily Rios Gracias por el indicador, tengo una pregunta necesito programar un screener de valores que e...
mmoren44 no esta el color azul (Fade //Blue), No aparece en las barras el color azul.
larouedegann changer fade coloured (0,0,255)
Nicolas 1. yes 2. maybe yes?! 3. why not?
patapouf Bonjour Nicolas. Je viens de découvrir cet indicateur, que je trouve bien intéressant Mais...
Nicolas Tu peux modifier le paramètre "scalefactor" pour adapter la hauteur des barres à ton graphiq...
bolsatrilera EM MONEY FLOW INDEX + ALERTS //@version=3 // on platform Tradingview by DreamsDefined //a...
Carlos Garcia Enorme. Gracias!
Andraxx Buen indicador.... Gracias
TAC Bolsa All indicators share some code of other TAC indicators that improve the functioning of this ...
ramonjp Hi Tac, Great job. Please, can you provide latest code version of this indicator without ...
Tze Khai Lim Hi Tac, pls provide latest code version of this indicator. Thanks in advance.
TAC Bolsa Estas equivocado al 99,9%. La correlación entre las series de precios y volúmenes las des...
Domenec Si hablas de un indice regional como el Ibex es posible que sea asi yo nunca lo he operado y...
TAC Bolsa Regional de Mostoles, en una cosa tienes razón mejor dejarlo aquí...
Xusto Hello, Fully Agree, I will update it with your advice. Btw Can would you like share you co...
Niklas johansson hägglund do you now if it's possible to use this strategy with this code in tradingview also?
Alexander9 This code for metastock ?, can for amibroker . Thanks
TACBOLSA
7 years ago
luxrun Thank you so much Tac BOLSA, I can not post the picture tonight I'll try tomorrow. I loaded ...
TAC Bolsa A new version of TAC Volume HPI DIV10.4 is available. that marks the divergence In the fo...
Raymundo Buenas tardes. Como puedo descargar algunos indicadores de esta pagina ?

Top