Monthly, Weekly and Daily Activity and Equity

v10.3
Monthly, Weekly and Daily Activity and Equity

This collection of nine simple indicators is a further development of my indicator found here:

https://www.prorealcode.com/prorealtime-indicators/most-active-hours-and-months/

The first set of three indicators analyses the range to show any month/week/day of week that has historically had higher or lower than average range.

The second set analyses the volume to show any month/week/day of week that has historically had higher or lower than average volume.

The third set analyses the equity gain or loss to show any month/week/day of week that has historically had higher than average positive or negative equity.

Each indicator must be applied to the relevant time frame chart – so monthly on monthly, weekly on weekly and daily on daily.

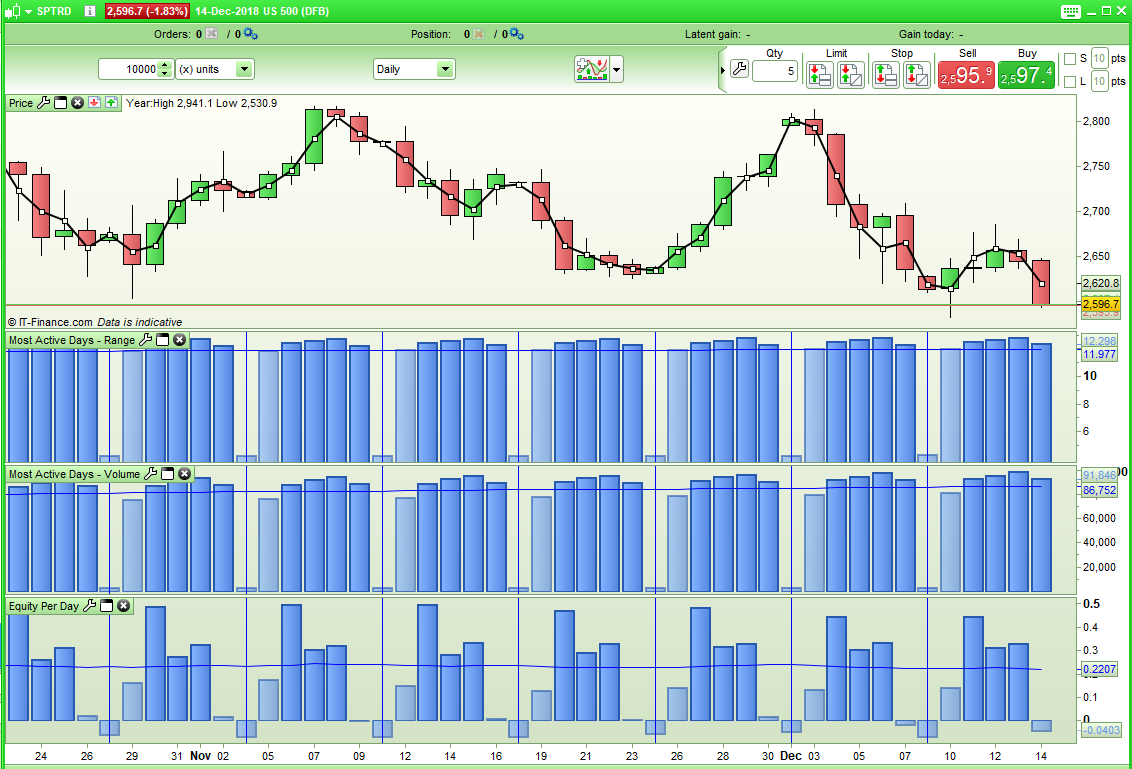
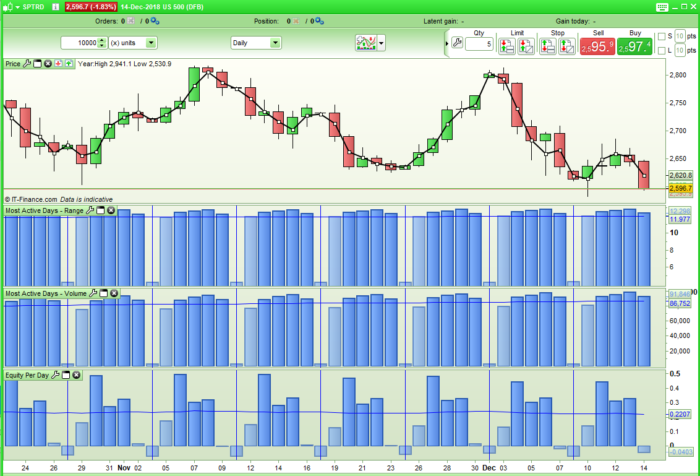
In the attached image it can clearly be seen that on the SP500 Tuesday, Wednesday and Thursday have been good days to go long and that Tuesday, Wednesday, Thursday and Friday have had above average volume and above average range, Mondays have been quieter.

We do have to consider that the Sunday candle is based on a shorter day and that there has not always been a Sunday candle in all of the historical data.

In the weekly analysis we have to take into consideration that PRT has no way to tell us what week of the year it is so I have started counting from the moment a new year is detected. Not all years have 52 x 6 trading days in them so this can lead to some years having 53 weeks. So the data around the start of a new year can be a little difficult and shorter weeks than the 6 trading days may be used leading to inaccurate returns by the indicator for those weeks either side of a new year’s start.

Also bear in mind that volume information is not available for all instruments and has only been available in PRT for recent history.

Share this

Risk disclosure:

No information on this site is investment advice or a solicitation to buy or sell any financial instrument. Past performance is not indicative of future results. Trading may expose you to risk of loss greater than your deposits and is only suitable for experienced investors who have sufficient financial means to bear such risk.

ProRealTime ITF files and other attachments : How to import ITF files into ProRealTime platform?

PRC is also on YouTube, subscribe to our channel for exclusive content and tutorials
avatar
Register or

Likes

avatar avatar avatar avatar avatar avatar avatar
Related users ' posts
Nicolas
7 years ago
Trinity Impulse
Trinity Impulse
5
Indicators
ribou ah d'accord merci beaucoup
domenico nlevel1 non modifica la curva al variare del suo valore
tiger_man_no1 Very nice ; what is the best period input date for DAILY CHART ?
rb-72 Thank you, area of twist by dilatacion of the price, missing part of the code that is not pu...
Thomas007 after reading your blog now I understand why there is only a part of your code here. I'm try...
Juanjo Hola¡¡ la estrategia se podria aplicar sobre acciones con marco temporal diario?? gracias.
rb-72 5 Minutes, 15 Minutes, The most effective 1 Hour below 0 or above 0 as a turn signal in the ...
Andraxx Interpretación de el indicador??? Gracias
TAC Bolsa Oscilador que hace una medición ponderara basado en la distancia entre precio y una media Mó...
Nicolas Better to download the file from the page and import it into your platform in order to not c...
marcov66 Hi Nicolas, thanks for sharing the VWAP Date Indicator. It is really powerful. Nevertheless,...
Nicolas Are you sure you are using the same exact date, hours, minutes, seconds for anchor?
julien1978 changing the trendDetectionLength setting does not seem to have any effect on the wave calcu...
arran i can't seem to get this indicator to work on forex pairs. it works great on indices etc. An...
Nicolas Indicator needs Volume, and there are no volumes with forex pairs with IG.
Trading_En_El_Ibex35 El screener no busca acciones que estén en máximos absolutos , busca acciones en las que el...
Andraxx lo de volumen aceptable, lo dices en relación al Ibex 35 supongo. Porque se margen de volume...
Juanjo Hola Queria preguntarte si la idea de maximos anuales es tuya, o bien está basada en el sis...
BERTJES82 Hi Nicolas, is it possible to adjust the starting date of the VWAP on the charts? Thanks in ...
Nicolas Yes, have a look there: https://www.prorealcode.com/prorealtime-indicators/vwap-date-anchored/
Dadoo Merci Nicolas!
haseluis Hello, who can help me why the screener does not work // Der folgende Code bezieht sich auf...
Nicolas Hello, please ask your question with a new forum topic, this is not the place to ask for sup...
Thomas007 Is there any way to build something similar for FX? I wonder what would be the replacement f...
Jean-Pierre Poulain When I buy and when I sell ?
Nicolas The featured image of the post do not deserve the indicator you are right, I attached other ...
Nicolas It is described in the post already :) The BUY/SELL signals are quite similar of what you ca...
imokdesign Hi Everybody, when I look at the strategy I felt the need to implement a Moneymanagement-Sy...
Inertia newlevel then multiplier=multiplier+1 oldlevel=newlevel newlevel=strategyprofit+startequi...
Inertia Hi Bjoern, I was playing around with your code this morning (EUR/USD 5'). Thank you to the...
Nicolas
8 years ago
jiminykricket Hi Nicolas, Its fair to say i'm a relative novice with ProRealtime and as such i am not sur...
Nicolas You can use assisted creation in probacktest, you'll get a quick overview on how to call a p...
jiminykricket Thanks Nicolas, i'll take a look
fabio407 Thanks, Nicolas. Very useful. Would you tell me where to find what result conveys the functi...
Nicolas This is not an instruction of the programming language but a variable from this indicator (l...
fabio407 OK. I didn't notice it. Many thanks, Nicolas!
Wilko And not only readable.... makes it much easier to iterate different entry/exit-conditions, d...
IGOSNELL Hi Interesting strategy, when I used $ M-R Dif EURUSD M15 Long if does not enter any positi...
ilvillans HI, I modified the system, from good results but from this error: Replace the variables wit...
bolsatrilera
8 years ago
Volume Stops
v10.3
Volume Stops
6
Indicators
Aragorna Hello, ask for a help, please. why the indicator in my PRT is in a different area and not in...
Nicolas Add it on the price chart: https://www.prorealcode.com/blog/video-tutorials/how-to-add-an-in...
Infanta Congratulations. Of all the indicators that I have been able to examine, in my opinion and f...
Nicolas si il n'y a pas de stoploss définit dans le code, alors c'est normal :)
bertrandpinoy bonjour merci pour la réponse. Oui b sur ... est il possible que le SL soit coder sous une a...
Nicolas ok mais pourquoi poser la question ici ? Pour des questions non spécifique à cette article, ...

Top