Monthly, Weekly and Daily Activity and Equity

v10.3
Monthly, Weekly and Daily Activity and Equity

This collection of nine simple indicators is a further development of my indicator found here:

https://www.prorealcode.com/prorealtime-indicators/most-active-hours-and-months/

The first set of three indicators analyses the range to show any month/week/day of week that has historically had higher or lower than average range.

The second set analyses the volume to show any month/week/day of week that has historically had higher or lower than average volume.

The third set analyses the equity gain or loss to show any month/week/day of week that has historically had higher than average positive or negative equity.

Each indicator must be applied to the relevant time frame chart – so monthly on monthly, weekly on weekly and daily on daily.

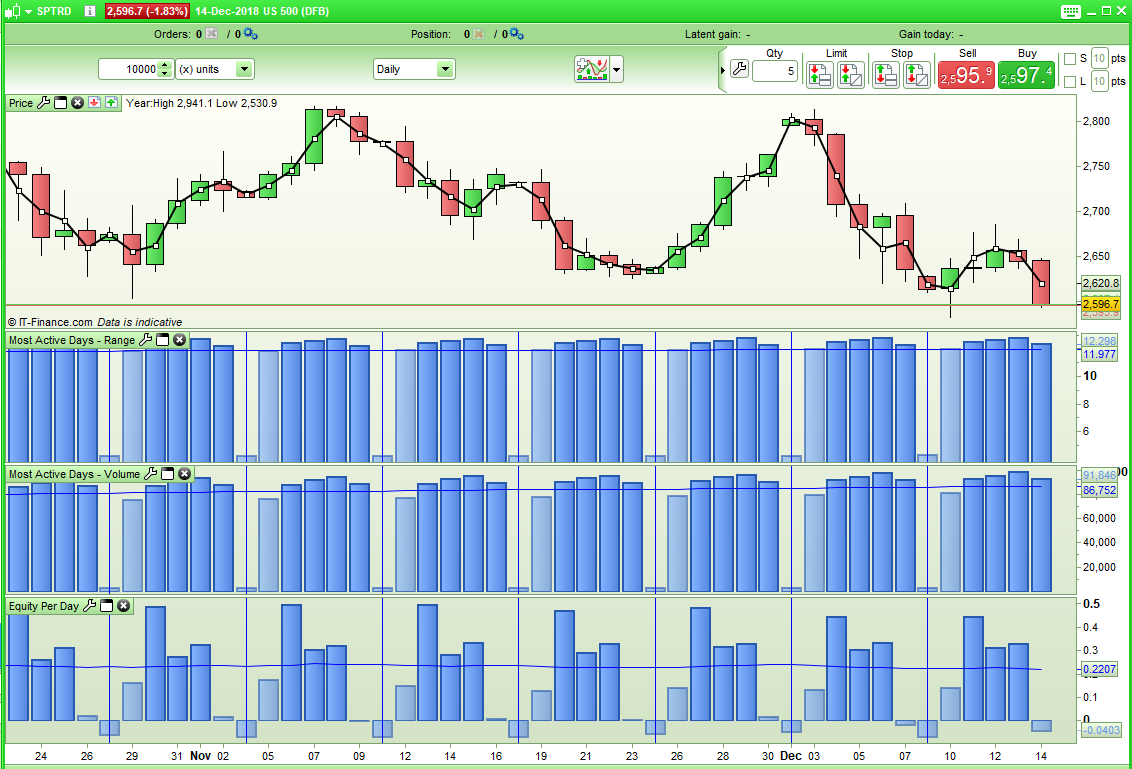
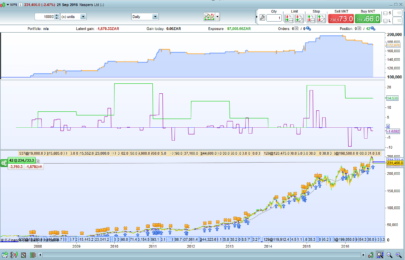
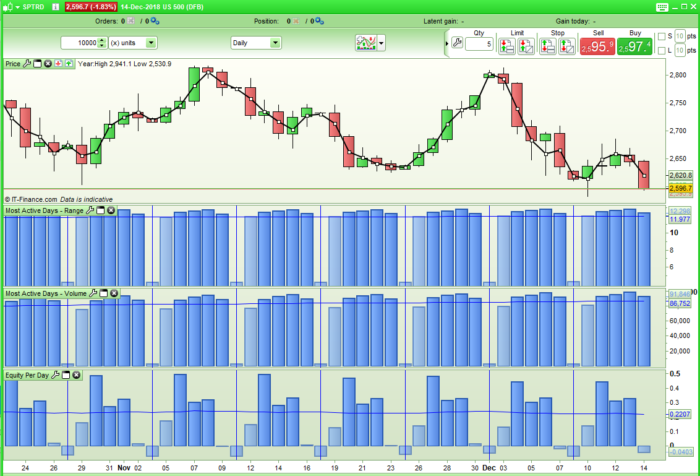
In the attached image it can clearly be seen that on the SP500 Tuesday, Wednesday and Thursday have been good days to go long and that Tuesday, Wednesday, Thursday and Friday have had above average volume and above average range, Mondays have been quieter.

We do have to consider that the Sunday candle is based on a shorter day and that there has not always been a Sunday candle in all of the historical data.

In the weekly analysis we have to take into consideration that PRT has no way to tell us what week of the year it is so I have started counting from the moment a new year is detected. Not all years have 52 x 6 trading days in them so this can lead to some years having 53 weeks. So the data around the start of a new year can be a little difficult and shorter weeks than the 6 trading days may be used leading to inaccurate returns by the indicator for those weeks either side of a new year’s start.

Also bear in mind that volume information is not available for all instruments and has only been available in PRT for recent history.

Share this

Risk disclosure:

No information on this site is investment advice or a solicitation to buy or sell any financial instrument. Past performance is not indicative of future results. Trading may expose you to risk of loss greater than your deposits and is only suitable for experienced investors who have sufficient financial means to bear such risk.

ProRealTime ITF files and other attachments : How to import ITF files into ProRealTime platform?

PRC is also on YouTube, subscribe to our channel for exclusive content and tutorials
avatar
Register or

Likes

avatar avatar avatar avatar avatar avatar avatar
Related users ' posts
Nicolas
8 years ago
Voluminator
Voluminator
0
Indicators
Nicolas
8 years ago
Nicolas Sure, please open a new topic in the probuilder forum with all specifications needed.
toni1750 Hola, funciona en P11? lo he puesto y no me sale como en la imagen. gracias.
GustavoLoboOrenstein Hello Nicolas, I have a cumulative histogram update problem, the indicator often updates ...
julien1978 The ADR value that is plotted intraday does not match the value of the regular ATR indicator...
Fab666 I've tried to get a fix for this also but no luck, it doesn't print the correct data as far ...
Seabiscuit Hi! With the new PRT update, this indicator does not work anymore
Nicolas That's right, in ProScreener we can't have a lookback more than 254 days. There is nothing w...
cjdevasia Hi, Nicolas,     please guide me how can i scan following conditions in pro real time  S...
Nicolas For everyone benefit, I prefer to answer coding request in the forum. Please open a new topi...
Nicolas Thanks for contributing to the "ichimoku section" of the prorealtime code library Don't he...
sourberry Thank you , this is a great indicator works beautifully. Could you kindly modify to scr...
pp_playaflamenca Excuse me,... reading your code about spanB: [ SenkouSpanBFutureW = (Highest[SenkouSpanPerio...
Nicolas
8 years ago
Better Volume
Better Volume
39
Indicators
Keyeming Hello Nicolas; not sure to undersntad line 167, and in the video I d'ont remember that the a...
Nicolas I don't know, this code is 6 years old and I made a 1:1 translation of the provided code by ...
Alai-n https://emini-watch.com/free-stuff/volume-indicator/
Nicolas
9 years ago
Nicolas You will find the VWAP code from PRT here: https://www.prorealcode.com/topic/is-there-any-wo...
keks Thanks for sharing this wonderful code. Is there a way to draw a horizontal line to plot pre...
taklause Hello, just one question, can it be that this indicator does not work on ProRealTime v12? T...
Reiner
9 years ago
Nicolas You should join and read the forum thread about this strategy. There are plenty of different...
Reiner Hi djtaktik and welcome, I have answered your question in the related Pathfinder forum beca...
danver34 is this version the definitive one or from the original one have there been modifications to...
Doctrading Hello,  The strategy should be improved, no doubt. But it was just one of my ideas, which h...
ALEALE Yes Nicolas is very difficult, macro economic data can destroy any work!!  
styrke depends which.. I personally think that it's much more easier to trade on XBTUSD, try to co...
David Thanks for the explanation Nicolas.
freecat1899 Hello, I wanted to create a percent ADR based on this indicator, so I wrote this code that I...
revstrat At first glance, I see this mistake. You shouldn't average the highs and the lows. You shoul...
GraHal Ooops got that excited I sent that last one twice! ha (and can't delete it, sorry) I got it...
Eric n = 3  dont forget to allow 3 contract in proorder
UkCoopDownUnder Tried EURUSD GMT and GMT -1, as far back as I can go, Nov 2018 on 15mn Tf, 22% loss
Doctrading Yes, nice idea.
noisette I tried some backtests with "9:30 MACD" with "Breakout strategy" but results are much better...
Doctrading Hello, can you send us your code ?
Doctrading Thanks, man !
rajiwas How is it possible to add currentWeekHigh and currentWeekLow, currentWeekOpen and currentWee...
Takeshi Totally don't match the PRT basic pivots on weekly
Nicolas
9 years ago
trabucaire Hello, what does it mean the 20 and 40 number on this code ? Thank you !
robertogozzi I modified it to make parameters customizable and to Draw a Grey candlestick when a range is...
Nicolas
9 years ago
Up on Big Volume
Up on Big Volume
0
Screeners
Nicolas
9 years ago
Nicolas
9 years ago
Nicolas
10 years ago
Nicolas Just replace the last line with this : RETURN dm as "Volume Weighted MACD", masignal as "Si...
thomas2004ch I happen to read this article. I would say the formel 'd = maslow - mafast' could be inverse...
Nicolas You are right! but still the picture is looking good. The formula is inverted! dunno why :) ...

Top