

Moving Average Angle (Stochastic)
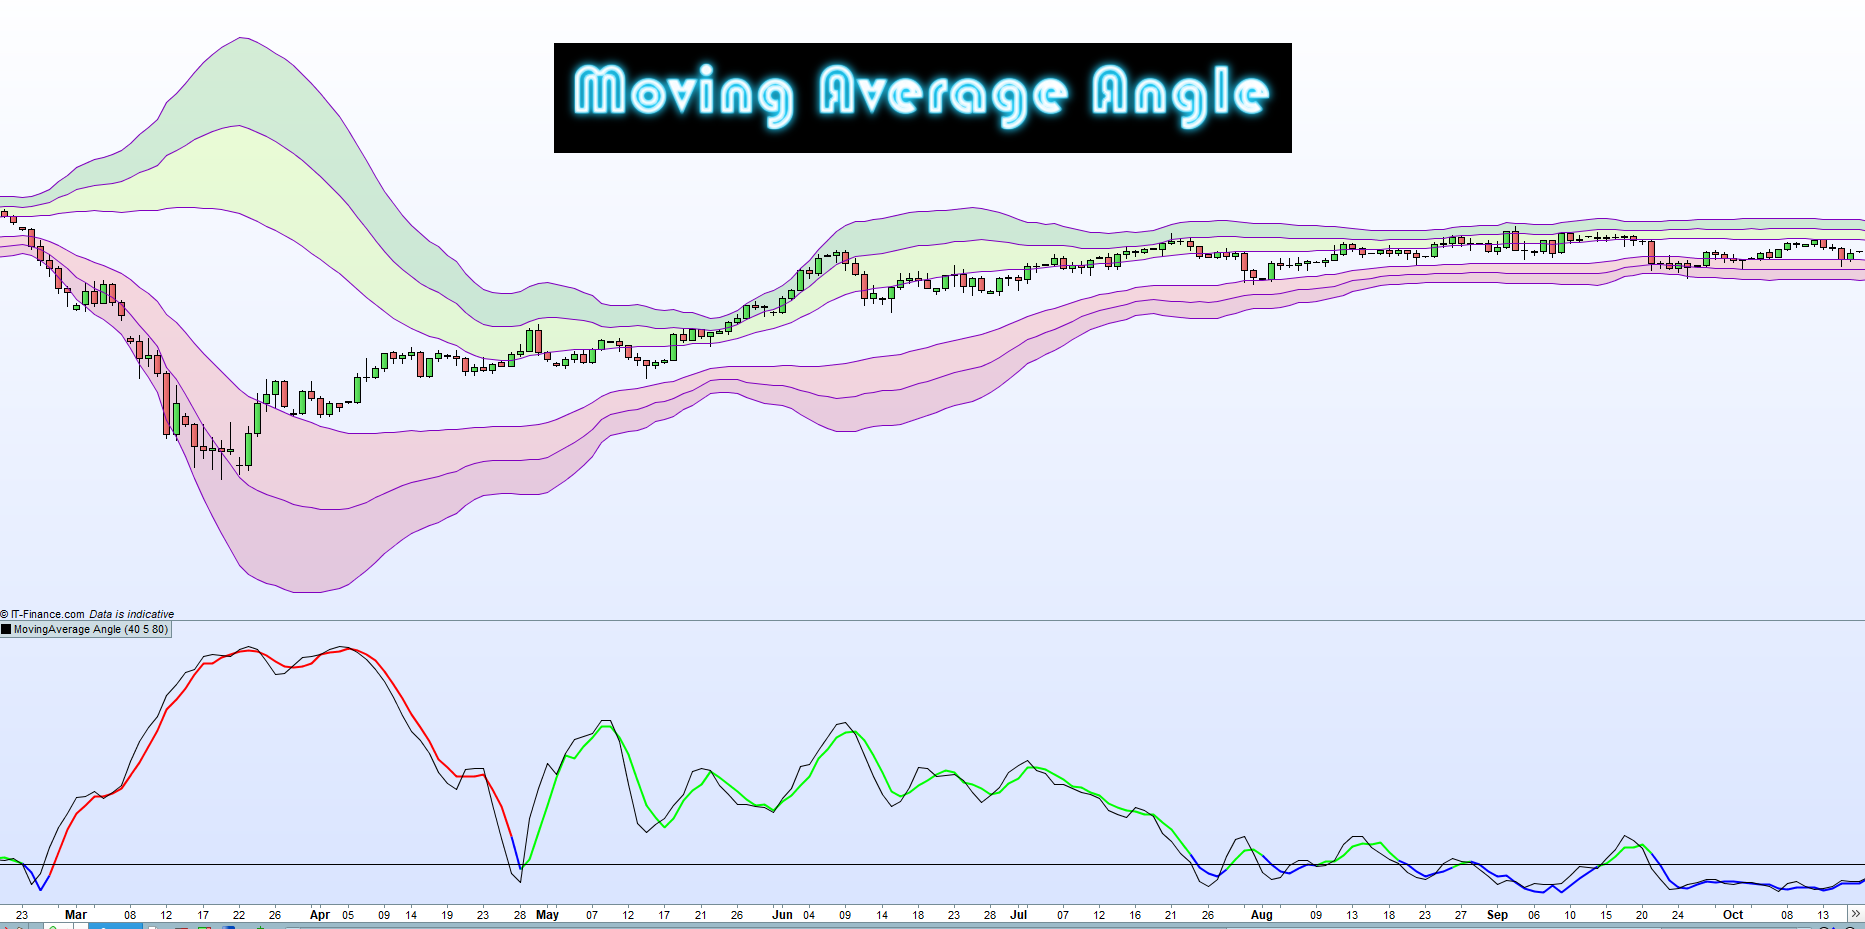
This is a stochastic type representation of the moving average angle. This means that an ascending value will represent a stronger trend while descending value will represent a weakening trend leading to consolidation.
The indicator is color coded meaning the color will represent the direction of the trend (green = bullish; red = bearish and blue = consolidation). There is also an customizable Angle Threshold that can be set to help identify the consolidation zone, meaning if the value crosses below this value it could indicate possible consolidation.
Furthermore there is a signal line (black) that draws a slightly faster version of the angle line providing early signals and leading trend direction.
The customizable input parameters is as follow:
Moving Average Period
Angle Threshold
Sample Period (period used to calculate the signal line)
*Download and import the ITF file for all input parameters
//Calculate angle of MA

//MAPeriod = 40
//SamplePeriod = 5
//AngleThreshold = 45

MA = average[MAPeriod](close)
MAAngle = (sin(atan((MA-MA[1])/MA[1]*100)))*1000//R2[MAPeriod](close)*100

AverageAngle = Average[SamplePeriod](MAAngle)
AverageAngle2 = Average[round(SamplePeriod/2)](MAAngle)

If AverageAngle > AngleThreshold Then
R = 0
G = 255
B = 0
ElsIf AverageAngle < (AngleThreshold*-1) Then
R = 255
G = 0
B = 0
Else
R = 0
G = 0
B = 255
EndIf

AverageAngleD = abs(AverageAngle)
AverageAngle2D = abs(AverageAngle2)

Return AverageAngleD coloured(R,G,B) style(Line,2) as "AverageAngle", AverageAngle2D as "AverageAngle2", AngleThreshold