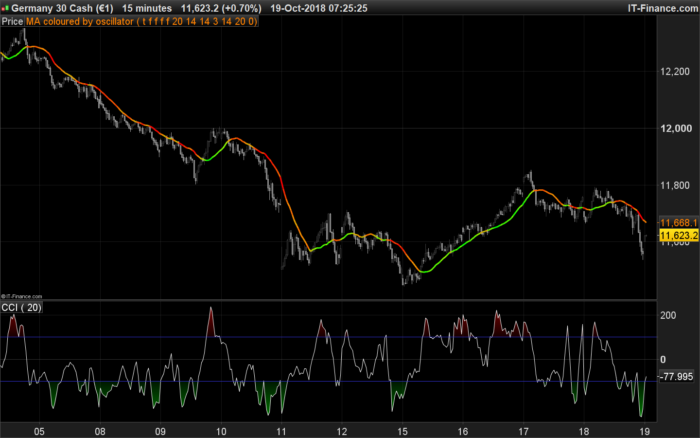
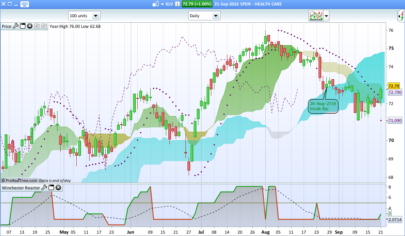
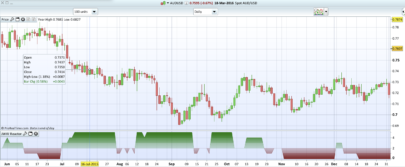
This indicator plots moving average of chosen period and type, automatically colorized from the chosen oscillator state.
5 types of oscillator can colorized the moving average depending on their overbought and oversold situation:
- CCI (Commodity Channel Index)
- RSI (Relative Strength Index)
- Stochastic
- Cycle
- DI (Directional Index)
This indicator is based on the great version from ALE: 3D Candlesticks (CCI,RSI,Stochastic,Cycle,DI) and coded following a request made in the technical indicators forum.
|
1 2 3 4 5 6 7 8 9 10 11 12 13 14 15 16 17 18 19 20 21 22 23 24 25 26 27 28 29 30 31 32 33 34 35 36 37 38 39 40 41 42 43 44 45 46 |
//PRC_Colourized MovingAverage | indicator //19.10.2018 //Nicolas @ www.prorealcode.com //Sharing ProRealTime knowledge // --- settings ONCE UseCci =0 // COMMODITY CHANNEL INDEX COLOUR ONCE UseRsi =0 // RSI COLOUR ONCE UseStochastic =0 // STOCHASTIC COLOUR ONCE UseCycle =0 // CYCLE COLOUR ONCE UseDI =0 // DIRECTIONAL INDEX COLOUR // --- ONCE CciPeriod =20 ONCE RsiPeriod =14 ONCE N =14 ONCE K =3 ONCE DiPeriod =14 ONCE MAperiod =20 ONCE MAtype =0 //0=SMA // --- end of settings If UseCci then // CANDLE + COMMODITY CHANNEL INDEX COLOUR MyCci = Cci[max(1,CciPeriod)](customclose) R = (200-MyCci) G =(200+MyCci) Elsif UseRsi then // CANDLE + RSI COLOUR MyRsi = RSI[max(1,RsiPeriod)](customclose) R =50+(200-(MyRsi-50)*12) G =50+(200+(MyRsi-50)*12) Elsif UseStochastic then // CANDLE + STOCHASTIC COLOUR MyStoch = Stochastic[max(1,N),max(1,K)](customclose) R =50+(200-(MyStoch-50)*6) G =50+(200+(MyStoch-50)*6) Elsif UseCycle then // CANDLE + CYCLE COLOUR MyCycle = Cycle(customclose) R = (200-MyCycle*10) G =(200+MyCycle*10) Elsif UseDI then // CANDLE + DIRECTIONAL INDEX MyDi = DI[max(1,DiPeriod)](customclose) R = 50+(200-MyDi*10) G =50+(200+MyDi*10) endif avg = average[MAperiod,MAtype](customclose) Return avg coloured(R,G,0) style(line,3) as "MA coloured by oscillator" |
Share this
No information on this site is investment advice or a solicitation to buy or sell any financial instrument. Past performance is not indicative of future results. Trading may expose you to risk of loss greater than your deposits and is only suitable for experienced investors who have sufficient financial means to bear such risk.
ProRealTime ITF files and other attachments :
Find other exclusive trading pro-tools on ![]()
PRC is also on YouTube, subscribe to our channel for exclusive content and tutorials


Good evening Nicholas, I can not see the colors on the line of the moving average, but only a black line. Maybe I was wrong in the settings? Thank you
Yes, you must choose the oscillator that will color the moving average.
Example: ONCE UseCci =1
Excellent indicateur ! Déterminer une tendance est devenu un jeu d’enfants ! Félicitation…
Pouvez-vous m’expliquer comment changer la couleur de la moyenne mobile ?
bonjour nicolas
j ai cherché partout sur le net et impossible de trouvé ce que je recherche et je suis tombé sur cet indicateur, je recherche un cci borné entre 200 et -200 si possible que je puisse réglé, avec 3 sma avec la fonction decay (décalage)et réglage de base expo, pondéré etc, les conditions achat sont lorsque le cci est supérieur à -200 et que le cci passe au dessus de la sma 1 et sma 2 affiche arrowup et lorsque le cci passe en dessous de la sma 3 arrow up, les conditions de ventes sont les même inversé,
cci est inferieur à 200 et que le cci passe au dessous de la sma 1 et sma 2 affiche arrowdown et lorsque le cci passe au dessus de la sma 3 arrow down,peut on affiché les arrow directement sur le graphique si possible et que je puisse bidouillé le code parce que j apprend mais pas encore en mesure de le faire moi même mais c est comme cela qu on apprend je crois bien.
si c était possible d avoir un coup de main cela serait vraiment très gentil de votre part et motiverais un débutant, je vous remercie pour tout le travail que vous fournissez sur votre site c est vraiment remarquable.
très cordialement.
merci
greg
Merci de poster une demande dans le forum des indicateurs, ainsi on pourra le coder dans ce contexte.