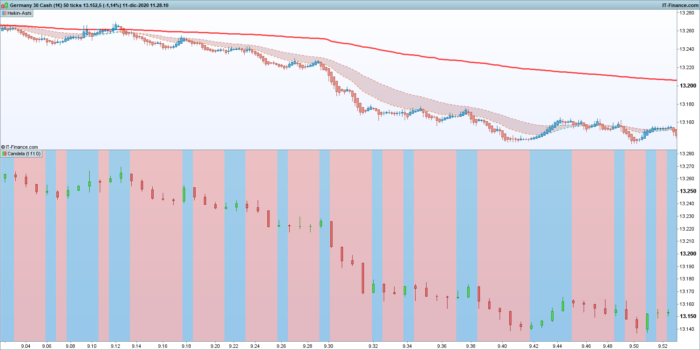
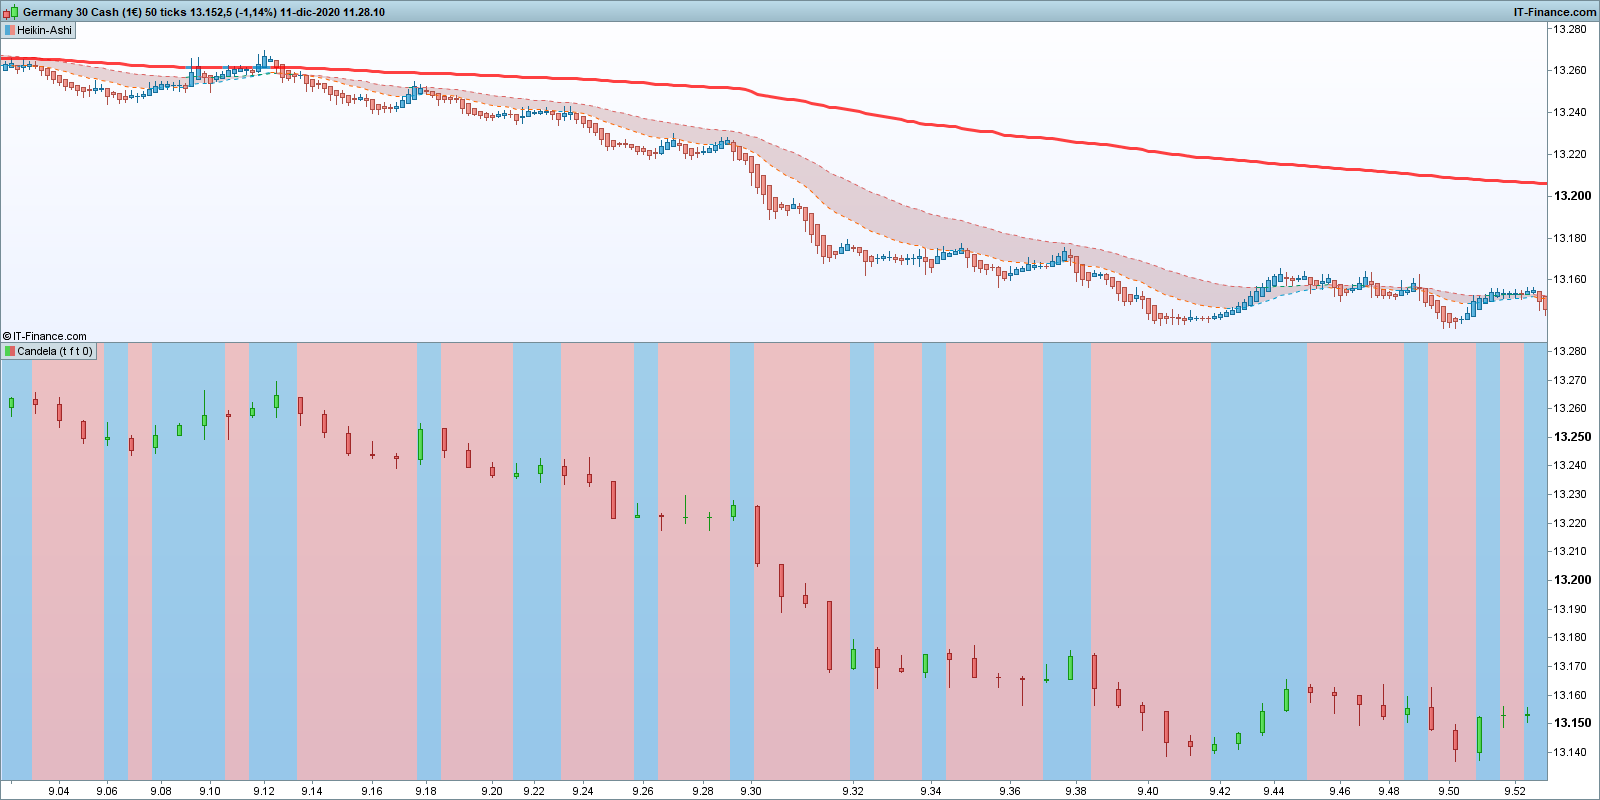
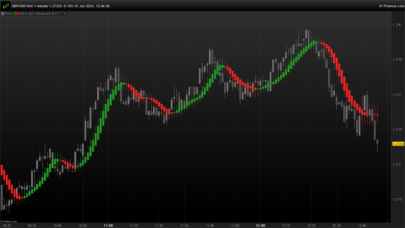
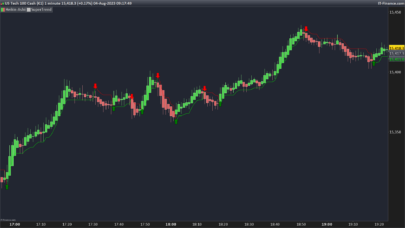
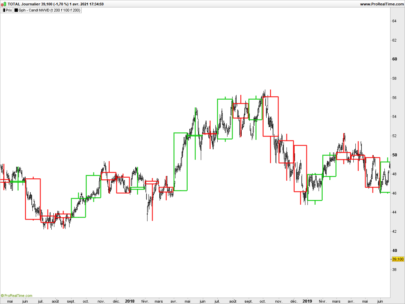
This indicator allows you to draw higher timeframes candles on your default timeframe chart.
So the indicator has four inputs:
- “drawPrice“: check it if you want to plot price candles
- “drawHeikinAshi“: check it if you want to plot heikin-ashi candles (if this is the case the “drawPrice” input will be ignored)
- “drawBg“: check it if you want to plot a background based on the bar color
- “shift“: a correction shift to compare exactly with the higher timeframe chart
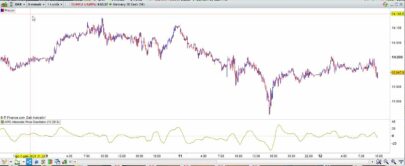
The attached “itf” is for having a higher timeframe of 200 ticks (as shown in the picture), but you can import the code anyway and then change the “timeframe” line of code accordingly with your desired higher timeframe.
|
1 2 3 4 5 6 7 8 9 10 11 12 13 14 15 16 17 18 19 20 21 22 23 24 25 26 27 28 29 30 31 32 33 34 35 36 37 38 39 40 41 42 43 44 45 46 47 48 49 50 51 52 53 54 55 56 57 58 59 60 61 62 63 64 65 66 67 68 69 70 71 72 73 74 75 76 77 78 79 80 81 82 83 84 85 86 87 88 89 90 91 92 93 94 95 96 97 98 |
// MTF Candles // 10.12.2020 // Daniele Maddaluno // // Settings: // drawPrice = 1 // drawHeikinAshi = 0 // drawBg = 0 // shift = 0 // // 0 = current bar // 1 = prev bar timeframe(TF_MULTIPLE_OF_DEFAULT, updateonclose) // --> change this line with a tf multiple of your default tf IBar = barindex TBar = opentime timeframe(default, updateonclose) // Computes the multiple m of the default timeframe and updates the shift accordingly once config = 0 if not config and barindex > 0 then if summation[barindex](TBar <> TBar[1]) > 1 then m = 0 for i = 0 to barindex do if opentime[i] = TBar then m = i + 1 config = 1 shift = shift mod m break endif next endif endif if config then newBar = IBar[1+shift] <> IBar[2+shift] // Resets the haO1 for Heikin-Ashii bars if drawHeikinAshi then once haO1reset = 0 if (not haO1reset) and (barindex > 0) then if summation[barindex](newbar) <= 1 then haO1 = open // first bars are not correct, but will converge really fast to HA correct values else haO1reset = 1 endif endif endif // Configures bar values if newBar then Open1 = Open0 High1 = max(High0, High[1]) Low1 = min(Low0, Low[1]) Close1 = Close[1] Open0 = Open High0 = 0 Low0 = +1073741824 // 2^30 if drawPrice then drawcandle(Open1, High1, Low1, Close1) endif if drawHeikinAshi then haC1 = (Close1 + Open1 + High1 + Low1)/4 haO1 = (haO1[1] + haC1[1])/2 haH1 = max( haC1, max( haO1, High1 ) ) haL1 = min( haC1, min( haO1, Low1 ) ) drawcandle(haO1, haH1, haL1, haC1) endif else Low0 = min(Low0, Low[1]) High0 = max(High0, High[1]) endif once bgAlpha = 128 backgroundcolor(0, 0, 0, 0) if drawBg then if drawPrice then if Close1>Open1 then backgroundcolor(83, 170, 213, bgAlpha) else backgroundcolor(236, 142, 133, bgAlpha) endif endif if drawHeikinAshi then if haC1<haO1 then backgroundcolor(236, 142, 133, bgAlpha) else backgroundcolor(83, 170, 213, bgAlpha) endif endif endif endif return |
Share this
No information on this site is investment advice or a solicitation to buy or sell any financial instrument. Past performance is not indicative of future results. Trading may expose you to risk of loss greater than your deposits and is only suitable for experienced investors who have sufficient financial means to bear such risk.
ProRealTime ITF files and other attachments :PRC is also on YouTube, subscribe to our channel for exclusive content and tutorials







Good job !