Nicolas

Multi Z-Score analysis
Category: Indicators By: Nicolas Created: June 26, 2018, 12:15 PM
June 26, 2018, 12:15 PM
Indicators
19 Comments
Multi Z-Score analysis

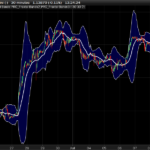
This indicator is a quick attempt to represent the distance of prices from their averages using the Zscore.
By using the DRAWTEXT graphical function in a loop, you can display a large amount of information at the same time.

The Zscore is calculated dynamically against several moving averages for as many “definition” periods. The variable “definition” is a multiplier.

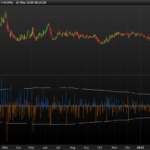
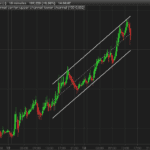
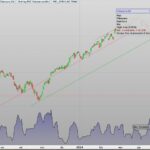
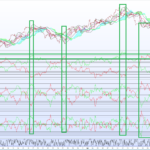
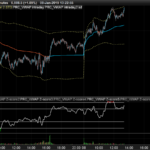
What the indicator shows us is that the price both to return more quickly to its mean when few Zscore (1 Zscore = 1 point on the graph) exceeds a deviation of 2 standard deviations and that quickly, while many other points form a compact package.

Other observations could be formulated for different types of graphs, time horizons and ways to trade, I leave you the pleasure to test by yourself 🙂

//PRC_multipleZscore analysis | indicator
//26.06.2018
//Nicolas @ www.prorealcode.com
//Sharing ProRealTime knowledge

//--- settings 
period = 20
MAtype = 1
definition = 100
//--- end of settings 

globalz=0

for i = 1 to definition do
 avg = average[period*i,MAtype](customclose)
 st = std[period*i](customclose)

 zscore = (customclose-avg)/st

 if zscore<0 then
  r=255-(30*i)
  g=0
  drawtext(".",barindex,zscore,Dialog,Bold,20) coloured(max(r,100),g,0)
 else
  r=0
  g=255-(30*i)
  drawtext(".",barindex,zscore,Dialog,Bold,20) coloured(r,max(g,100),0)
 endif

 globalz=(globalz+zscore*i)/definition

next
smooth=average[period](globalz)


RETURN 0 coloured(100,100,100) style(dottedline), 2 coloured(100,100,100) style(dottedline), -2 coloured(100,100,100) style(dottedline), 4 coloured(100,100,100) style(dottedline), -4 coloured(100,100,100) style(dottedline), smooth
 

Download
Filename: mean-reversion-with-Zscore-analysis.png
Downloads: 67
Download
Filename: PRC_multipleZscore-analysis.itf
Downloads: 228
Nicolas
Nicolas Legend
I created ProRealCode because I believe in the power of shared knowledge. I spend my time coding new tools and helping members solve complex problems. If you are stuck on a code or need a fresh perspective on a strategy, I am always willing to help. Welcome to the community!
Author’s Profile

Comments

j102491
1 year ago
#

Thank you

j102491
1 year ago
#

Hello, would this be the same as doing close-moving average and just getting the z-score of that?

Nicolas
1 year ago
#

No, you will get a distance in points. Here is the definition of Z-score: The z-score, also known as the standard score, is a statistical measure that describes how many standard deviations a data point is from the mean of a dataset.

Gianluca
8 years ago
#

Hello Nicolas, my prt become stuck when i load the indicator, is there any problem with it?

m-zeter
8 years ago
#

Hm, i dont know exactly why, but I think, that the indicator needs lots of power. I need also lots of time to load it. Maybe your computer has not enaugh power for it?

Brisvegas
8 years ago
#

Is this indicator for use in a binary sense or is it just a type of visual . If it is to be used as binary/boolean type signal what would your suggestion be ? It seems a little noisey to me , possibly i just dont get it .

Nicolas
8 years ago
#

Multiple zscore are plotted around many different time horizons means. Purely visual as you cant get a binary signal without any studies of all the information that are plotted by the indicator. As I wrote in the post, I let everyone make their own studies about the concept.

Sofitech
8 years ago
#

Is there a way to create a return value for the points so we can create alerts when some points are higher or lower of a value ? how can we modify the code to do that ?

m-zeter
8 years ago
#

Has anyone found a solution for Sofitech? Would it be possible to draw two lines? An upper line for the maximum points and a lower line for the minimum points. Would that be possible?

Nicolas
8 years ago
#

So many variables to be returned! The indicator is dynamic by its settings, so you can't know how much variables it would return, that's why I used dots made with a graphic instruction. Zscore is pretty much the same as a standard deviation, so bollinger bands do already this job for you.


Jose7674
8 years ago
#

Thanks for such a great job... I will try to use it in a trading system. Really great

Jan Wind
8 years ago
#

Nicolas, thanks for the code. "Smooth" does not seem to give any value (smooth=average[period](globalz)) If you can react on this, would be great ! KR Jan

Jan Wind
8 years ago
#

Nicolas, maybe the cause is that the values of / or the smooth line is not visible (??)

Nicolas
8 years ago
#

But it should, I'll test later.

alfapenna
8 years ago
#

I AM NOT VERY PRACTICAL ... IS IT POSSIBLE TO MAKE THE SCREENER WHEN AT LEAST A BALL EXCEEDS FROM 4 DEVIATION?

Jan Wind
8 years ago
#

Dear Alfapenna, I just saw my reply of this morning to you, it is completely mixed up (?) So I give it another try to answer your question: however ZFactor of 4 is an extreme value . if zscore< -4 then //ADJUSTED; was if zscore 4 then //NEW LINE r=0 g=255-(30*i) drawtext(".",barindex,zscore,Dialog,Bold,20) coloured(r,max(g,100),0) endif endif //NEW LINE

Jan Wind
8 years ago
#

Dear Alfapenna, I would think the following 3 additions/changes in the code will do; however 4 is an extreme value . if zscore <= -4 then (CHANGE INSTEAD OF = 4 then ( CHANGE ADDED LINE) r=0 g=255-(30*i) drawtext(".",barindex,zscore,Dialog,Bold,20) coloured(r,max(g,100),0) endif endif (CHANGE ADDED ADDITIONAL ENDIF)

alfapenna
8 years ago
#

good job! when it comes to the 4 standard deviation the price almost always breaks in

Nicolas
8 years ago
#

Yes because the mean is also moving, it is not stationnary :)

ProRealCode ProRealCode
Loading...