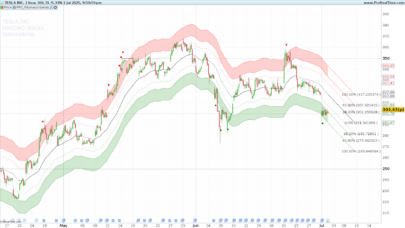
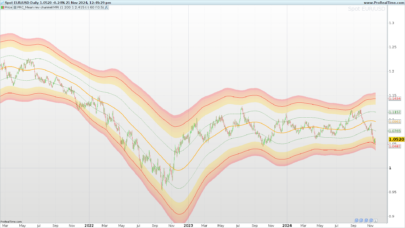
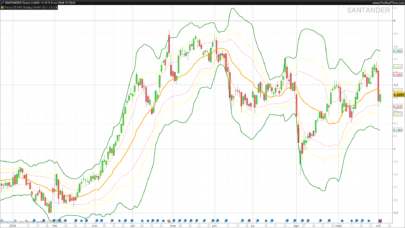
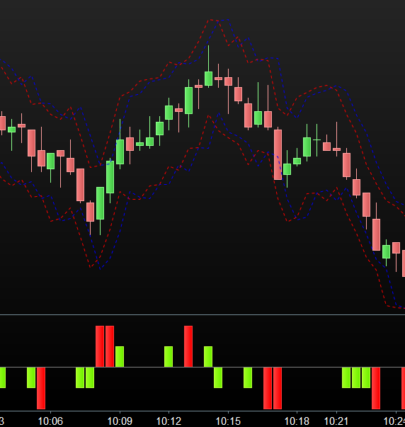
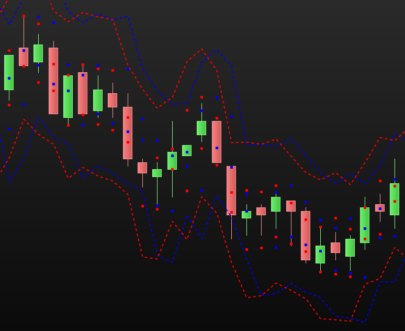
Another attempt to centering the price and measuring its derivative value, this time within its ATR with 3 different multipliers. You can play with this multipliers to change the way you can take signals on contrarian trades.
|
1 2 3 4 5 6 7 8 9 10 11 12 13 |
ma = exponentialaverage[length](close) myrange = range[length] rangema = exponentialaverage[atrlen](myrange) up1 = ma + rangema * mult1 up2 = ma + rangema * mult2 up3 = ma + rangema * mult3 dn1 = ma - rangema * mult1 dn2 = ma - rangema * mult2 dn3 = ma - rangema * mult3 RETURN ma, up1 COLOURED(202,255,112),up2 COLOURED(202,255,112),up3 COLOURED(202,255,112),dn1 COLOURED(255,127,80),dn2 COLOURED(255,127,80),dn3 COLOURED(255,127,80) |
Share this
No information on this site is investment advice or a solicitation to buy or sell any financial instrument. Past performance is not indicative of future results. Trading may expose you to risk of loss greater than your deposits and is only suitable for experienced investors who have sufficient financial means to bear such risk.
ProRealTime ITF files and other attachments :PRC is also on YouTube, subscribe to our channel for exclusive content and tutorials






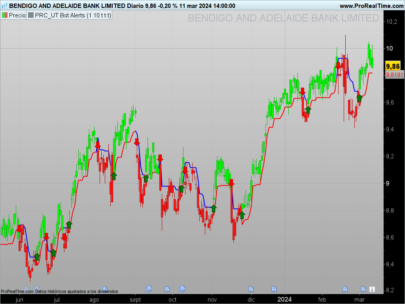
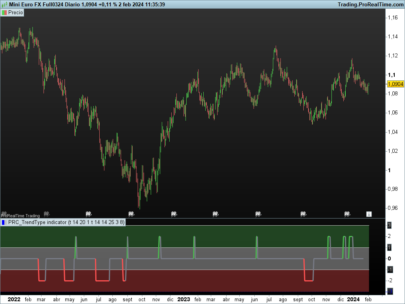


Hello , when I put the indicator on PRT , it does not turn with the chart but below in a separate window … I do not know why? An idea to help me ? Thank you 🙁
http://hpics.li/aca8539
It’s because you have to put the indicator on price, instead of put it in chart with the indicators button. Someone already asked this type of question on forum :
http://www.prorealcode.com/topic/display-of-custom-indicators/
ohhhh yes … thanks a lot mister ! :p
GRACIAS, MUY BUEN INDICADOR
¿PUEDES SACAR MAS INDICADORES DE BANDAS?
PARA MI SON LOS MEJORES PARA HACER SISTEMAS
Ciao Nicolas, inserisco l’indicatore sul prezzo ma purtroppo non succede nulla. Ho provato a pulire il grafico da tutti gli indicatori e a inserire solo questo, ma non funziona, non succede nulla. Cosa può essere secondo te?
Poiché è necessario caricare abbastanza barre per il calcolo per procedere correttamente. Estendi i tuoi periodi di ricerca del grafico.
Fatto, anche con giorni e settimane, ma non succede nulla lo stesso.
Ok, prova questo codice invece:
if barindex>length then
ma = exponentialaverage[length](close)
myrange = range[length]
rangema = exponentialaverage[atrlen](myrange)
up1 = ma + rangema * mult1
up2 = ma + rangema * mult2
up3 = ma + rangema * mult3
dn1 = ma - rangema * mult1
dn2 = ma - rangema * mult2
dn3 = ma - rangema * mult3
endif
RETURN ma, up1 COLOURED(202,255,112),up2 COLOURED(202,255,112),up3 COLOURED(202,255,112),dn1 COLOURED(255,127,80),dn2 COLOURED(255,127,80),dn3 COLOURED(255,127,80)
Niente da fare, mi dice:
“Errore di sintassi:
Definisci la variabile: lenght
Definisci la variabile: atrien
Definisci la variabile: mult1
Definisci la variabile: mult2
Definisci la variabile: mult3″
Hello,
Thank you for such an amazing work. However, I’m having some difficulty applying this indicator. It gives me following error (Image link). Can someone please explain what is wrong?
I have added the length and atrlenght but do not understand the mult1, 2 and 3. Can someone please explain what to do.
Image link:
https://ibb.co/cL2Sid
Thank you.
Regards,
Maisam
Hello all,
When I import the code here above “multiple ATR bands” and apply it on the PRT Force Index indicator chart (not on the PRICE chart) it produces a horizontal “0” line, but nothing else appears.
What should be changed in the here above code to have it be applicable to the Force index indicator chart?
Thx in advance
Peter
That should need some custom coding, if you want to make it done, please open a new topic in the ProBuilder forum.
Hello,
thanks for the indicator, i would like to change the color, is it possible, thanks