Murray math levels

Murray math levels

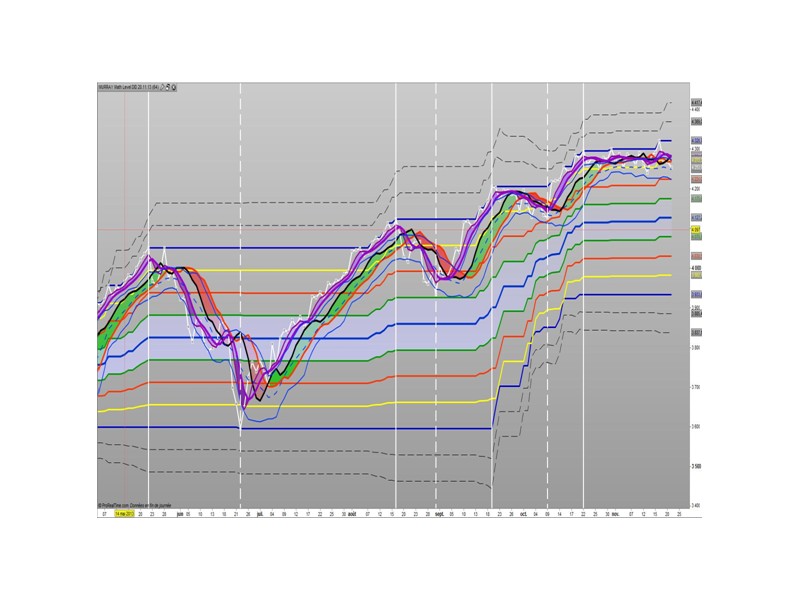
The Murrey Math lines levels are determined within some principles of Gann levels and candlesticks formations. The Murrey Math levels act pretty much like pivot and support/resistance areas.

1. Line 8/8 – 0/8 (Ultimate Support and Ultimate Resistance).
Those lines are the most strong concerning Support and resistance.

2. Line 7/8 (Weak, Place to Stop and Reverse).
This line is weak. If suddenly the price was going too fast and too far and stops around this line it means the price will reverse down very soon. If the price did not stop near this line this price will continue the movement to the line 8/8.
3. Line 1/8 (Weak, Place to Stop and Reverse).
This line is weak. If suddenly the price was going too fast and too far and stops around this line it means the price will reverse up very soon. If the price did not stop near this line this price will continue the movement down to the line 0/8.

4. Line 2/8 and 6/8 (Pivot, Reverse)
Those two lines yield the line 4/8 only to the strength to reverse the price movement.

5. Line 5/8 (Top of Trading Range)
The price is spending the about 40% of the time on the movement between the lines 5/8 and 3/8. If the price is moving near line 5/8 and stopping near the line during the 10 – 12 days so it means that it is necessary to sell in this “bonus zone” (some people are doing like this) but if the price is keeping the tendency to stay above 5/8 line, so it means that the price will be above. But if the price is droping below 5/8 line it means that the price will continue falling to the next level of resistance.

6. Line 3/8 (Bottom of Trading Range).
If the price is below this line and in uptrend it means that it will be very difficult for the price to break this level. If the price broke this line during the uptrend and staying above during the 10- 12 days it means that the price will be above this line during the 40% of its time moving between this line and 5/8 line.

7. Line 4/8 (Major Support/Resistance Line).
It is the major line concerning support and resistance. This level is the better for the new sell or buy. It is the strong level of support of the price is above 4/8. It is the fine resistance line if the price is below this 4/8 line.


Share this

Risk disclosure:

No information on this site is investment advice or a solicitation to buy or sell any financial instrument. Past performance is not indicative of future results. Trading may expose you to risk of loss greater than your deposits and is only suitable for experienced investors who have sufficient financial means to bear such risk.

ProRealTime ITF files and other attachments : How to import ITF files into ProRealTime platform?

PRC is also on YouTube, subscribe to our channel for exclusive content and tutorials

  1. MonopolyTm • 10/04/2016 #

    Hello, Do you think it is possible to code something similar to the example in the following link?
    https://www.fxstreet.com/analysis/murray-math-analysis-gbp-usd-eur-cad-201707211405

  2. robertogozzi • 10/04/2016 #

    Why HAUT and BAS have been calculated AFTER line 8?
    Shouldn’t they be calculated BEFORE line 6?

avatar
Register or

Likes

avatar avatar avatar avatar avatar avatar avatar avatar avatar
Related users ' posts
Iván
19 hours ago
Quino Line 86, just replace N by (N-1) . 1 degree of freedom
MaoRai54 Signal is not available as variable !!!!
MaoRai54 Shall I consider Signal=sig ?????
Iván you can see it in return line (sig as "Signal" coloured("orange")style(line,2))
Iván No, non è la stessa cosa. Basta guardare il modo in cui vengono calcolati i pivot.
Ciccarelli Franco Quale dei due mi consigli di usare?
Iván A me piacciono i concetti dello smart money, ma è solo la mia opinione.
shephinc When i download it says the file is corrupt and when i try to paste the code something gets ...
Iván if you open the file with V13 you will have no problems. You can copy/paste the original co...
shephinc Aha! Then I just need to figure out how to get v13. Is it released for IG customers?
efahmy Hi Ivan, I have one of your great indicatores to catch reversals, I tried to add voice alert...
Iván you can't use alerts inside indicator. Only works if you create an alarm (from the menu)
adeelq79 copy the code and create the indicator manually and it works.
Iván you can always copy/paste
Annchow8052014 but it loop back and make many boxes
Paolo.B Hi Ivan, great work. I'd love to try this indicator in an automated system, but I don't unde...
Maik2404 Hello. It would be very interesting to integrate this indicator into an automated trading sy...
Ciccarelli Franco Che cosa sono quei numeri a destra di Sell power e Buy power?
Iván d) Buy vs. Sell Power Over the last length candles, the script counts: Buy Power: ba...
Sofitech Hello Ivan is it possible to have an histogram version giving +1 when you have a green arrow...
YvesRobert Hello Ivan, I see that you are very good in PRT coding. Is it possible to have a code who se...
Iván Hi. It is not possible to detect true absorptions with ProBuilder code. The PRT language doe...
BZH22 Bonjour Ivan je suis à la recherche d' un indicateur pour avoir des points d' entrées et de...
Iván Provi a copiare e incollare il codice qui sopra. Che errore le dà?
Ciccarelli Franco Esattamente quanto scritto sopra
Ciccarelli Franco Ho provato a copiare ed incollare e funziona. Grazie
roccafragius Hi Ivan sorry another question, in order to create a bot that open the trade, I'm tryng to c...
roccafragius ////////////////////////////////////////// 0825-liquidity-test //--------------------------...
freddy382 Hello Ivan, I tested the indicator, which is great, but I only get the volume display for Bi...
Iván no it wasn't
xpe74 could be interesting to do so as visually it works well ....
xpe74 Hi ivan, still working on your indicator. Is there a way (as i'm not a coder) to integrate i...
Iván Danke, ich werde es berücksichtigen.
hartgeld Hallo Ivan, das ich das noch erleben darf....QQE in dieser Qualität bei ProRealTime...vielen...
Iván Ich freue mich sehr!

Top