Murray math levels

Murray math levels

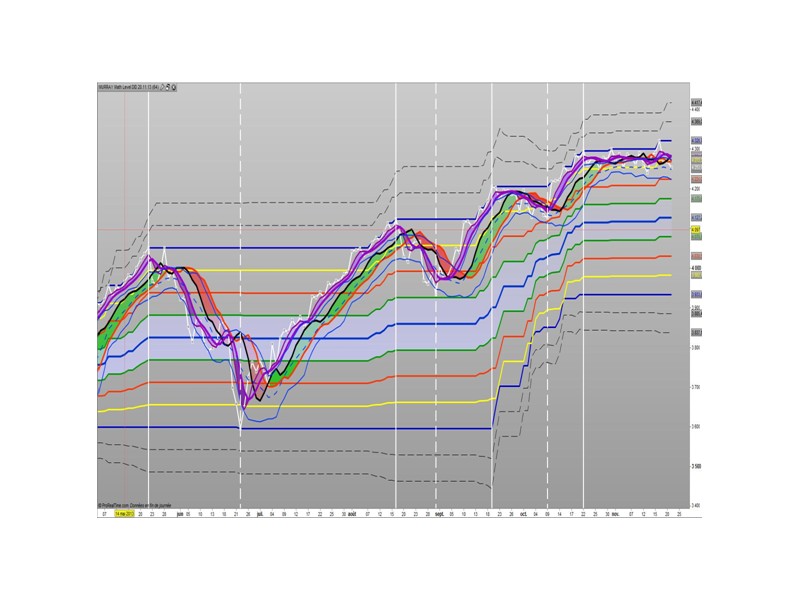
The Murrey Math lines levels are determined within some principles of Gann levels and candlesticks formations. The Murrey Math levels act pretty much like pivot and support/resistance areas.

1. Line 8/8 – 0/8 (Ultimate Support and Ultimate Resistance).
Those lines are the most strong concerning Support and resistance.

2. Line 7/8 (Weak, Place to Stop and Reverse).
This line is weak. If suddenly the price was going too fast and too far and stops around this line it means the price will reverse down very soon. If the price did not stop near this line this price will continue the movement to the line 8/8.
3. Line 1/8 (Weak, Place to Stop and Reverse).
This line is weak. If suddenly the price was going too fast and too far and stops around this line it means the price will reverse up very soon. If the price did not stop near this line this price will continue the movement down to the line 0/8.

4. Line 2/8 and 6/8 (Pivot, Reverse)
Those two lines yield the line 4/8 only to the strength to reverse the price movement.

5. Line 5/8 (Top of Trading Range)
The price is spending the about 40% of the time on the movement between the lines 5/8 and 3/8. If the price is moving near line 5/8 and stopping near the line during the 10 – 12 days so it means that it is necessary to sell in this “bonus zone” (some people are doing like this) but if the price is keeping the tendency to stay above 5/8 line, so it means that the price will be above. But if the price is droping below 5/8 line it means that the price will continue falling to the next level of resistance.

6. Line 3/8 (Bottom of Trading Range).
If the price is below this line and in uptrend it means that it will be very difficult for the price to break this level. If the price broke this line during the uptrend and staying above during the 10- 12 days it means that the price will be above this line during the 40% of its time moving between this line and 5/8 line.

7. Line 4/8 (Major Support/Resistance Line).
It is the major line concerning support and resistance. This level is the better for the new sell or buy. It is the strong level of support of the price is above 4/8. It is the fine resistance line if the price is below this 4/8 line.


Share this

Risk disclosure:

No information on this site is investment advice or a solicitation to buy or sell any financial instrument. Past performance is not indicative of future results. Trading may expose you to risk of loss greater than your deposits and is only suitable for experienced investors who have sufficient financial means to bear such risk.

ProRealTime ITF files and other attachments : How to import ITF files into ProRealTime platform?

PRC is also on YouTube, subscribe to our channel for exclusive content and tutorials

  1. MonopolyTm • 10/04/2016 #

    Hello, Do you think it is possible to code something similar to the example in the following link?
    https://www.fxstreet.com/analysis/murray-math-analysis-gbp-usd-eur-cad-201707211405

  2. robertogozzi • 10/04/2016 #

    Why HAUT and BAS have been calculated AFTER line 8?
    Shouldn’t they be calculated BEFORE line 6?

avatar
Register or

Likes

avatar avatar avatar avatar avatar avatar avatar avatar avatar
Related users ' posts
Choliver HI, Thanks a lot Good job. :-)
mscharstrom Hi @robertogozzi, I really love this indicator. However, I'd like to tinker with it to fit ...
Ahimsa Hi Roberto I cannot thank you enough for writing this code. It could help me more than you ...
Nicolas With PRT v11, you have to click on "price" at the upper left side of the price chart.
robertogozzi Firstly you need to make the correct calculation, you need to swap 22 and 7. Secondly PRT's...
SB-FO Sorry, i did forget to change the 7/22, I have run it both ways. PRT is calculating PPO a...
RubberToe I believe there is an error in line 23 of the MACD version. It points to the FastP. Should...
Leo I don't know, I just copy paste the strategy. The optimisation of the values I wrote them in...
bertrandpinoy hello Leo I'm spending time on your strategy code. do you agree to try to include this code ...
bertrandpinoy //version a: ajout filtre MM defparam cumulateorders=false // --- paramètres taille =...
Bard Problems with Safari latest s/ware and this site and links and adding code. Let me add the...
grimweasel47 Ok thanks Nicolas - could this be adapted to take into account MFI and then have price, volu...
Nicolas I don't understand what you mean exactly, would be better to open a topic about this idea wi...
Jesper Great share!
capgros Bonjour @Nicolas, Thanks a lot for this tool, it is very useful for me. I would like to s...
Hans63 Would you add the possibility to color also the Heikin Ashi and bar chart?
Nicolas That's possible, please open a new topic in the indicator forum explaining what you need exa...
Nicolas Change line 62 with: drawcandle(flup,fldn,flup,fldn) coloured(169,169,169,80) bordercolor(16...
DimKar Thank you very much from Greece sir , have a nice day ....!!!! Really i do not have words...
mit_ose Bonjour, J'ai d'excellents résultats avec cet indicateur simple et efficace; Merci beaucoup;
3agl3 voglio l indicatore
Victor.Strand Hi Pableitor, the code is just great; i was playing a lil bit with these factors, darwsegmen...
micky_red Hi, I have tried to use this indicator in version 12 and it doesn't work. Do you know how...
Victor.Strand Hey Micky, indicator works well, justpaste the code on the platform, or save it as an "itf" ...
ottimo Thank you Nicolas, great indicator, N. 1
tikigai Merci Nicolas! First Happy new Year 2020. Very good indicator BUT (yes the french "oui, m...
Nicolas Whats prorealtime version? Did you try in version prior to v11? indicator's call and loop ca...
jissey Bonjour Bolsatrilera,j'essaie de vous contacter pour le cm rsi ;je le trouve interessant, m...
jissey J'essaie de vous contacter pour l'indicateur"cm rsi"....
Vonasi No problem pableitor - I'm glad you like it.
pableitor Hi Vonasi, I was checking a few random weeks with your indicator and sometimes it seems to ...
Vonasi I have not checked your query on a chart but my guess is that you are reading the indicator ...
Nicolas Yes, that's how it goes when using loops..
JosephFelix Hi, Could I please have help with adding these indicators 'on price'? Every indicator that I...
Nicolas Just add it on price by clicking the wrench on the left upper side of the price chart.
Nicolas Thanks for create a specific thread in the forum in order to handle your coding query. I see...
Victor.Strand Thanks Nicolas, I didnt know there was a multitimeframe support now... I will check it. This...
Nicolas to return a value of a Close of timeframe 1-hour, for instance : TIMEFRAME(1 hour) c = close...
lokbuscas is it possible to make a screener with this conditions??? thank you
achel I believe so but I leave it to Nicolas to decide if it is possible
Nicolas Please open a new topic in the screeners forum
myhlo Super Nicolas !! Cet indicateur offre une nouvelle lecture du Rsi ! Ces bandes up & Dawn...
okiki please how can i acess the indicator i like it and want it please am new here
Nicolas download the itf file above and import it into your prorealtime platform: https://www.prorea...
Nicolas
6 years ago
BSTrend
v10.3
BSTrend
10
Indicators
Florian Legeard C’est à dire sur le prix et non sur le temps ? Merci
Rohit82189 bstrend repaints
Nicolas No, it doesn't repaint.
teddy58 Ich habe es mit N= 1,5 und N=2,5 getestet mit 200000 Einheiten. Es funktioniert leider erst ...
Matriciel I use this indicator to help me make a decision when there is a divergence. The divergences ...
Jan Wind Hi, I personnaly am not a big fan of ZIGZAG indicator, as it repaints itself during time. ...

Top