Murray math levels

Murray math levels

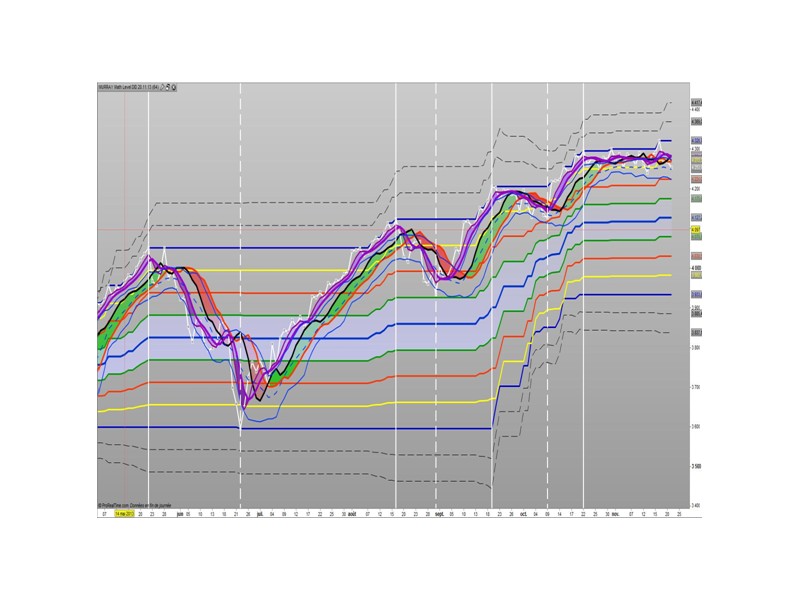
The Murrey Math lines levels are determined within some principles of Gann levels and candlesticks formations. The Murrey Math levels act pretty much like pivot and support/resistance areas.

1. Line 8/8 – 0/8 (Ultimate Support and Ultimate Resistance).
Those lines are the most strong concerning Support and resistance.

2. Line 7/8 (Weak, Place to Stop and Reverse).
This line is weak. If suddenly the price was going too fast and too far and stops around this line it means the price will reverse down very soon. If the price did not stop near this line this price will continue the movement to the line 8/8.
3. Line 1/8 (Weak, Place to Stop and Reverse).
This line is weak. If suddenly the price was going too fast and too far and stops around this line it means the price will reverse up very soon. If the price did not stop near this line this price will continue the movement down to the line 0/8.

4. Line 2/8 and 6/8 (Pivot, Reverse)
Those two lines yield the line 4/8 only to the strength to reverse the price movement.

5. Line 5/8 (Top of Trading Range)
The price is spending the about 40% of the time on the movement between the lines 5/8 and 3/8. If the price is moving near line 5/8 and stopping near the line during the 10 – 12 days so it means that it is necessary to sell in this “bonus zone” (some people are doing like this) but if the price is keeping the tendency to stay above 5/8 line, so it means that the price will be above. But if the price is droping below 5/8 line it means that the price will continue falling to the next level of resistance.

6. Line 3/8 (Bottom of Trading Range).
If the price is below this line and in uptrend it means that it will be very difficult for the price to break this level. If the price broke this line during the uptrend and staying above during the 10- 12 days it means that the price will be above this line during the 40% of its time moving between this line and 5/8 line.

7. Line 4/8 (Major Support/Resistance Line).
It is the major line concerning support and resistance. This level is the better for the new sell or buy. It is the strong level of support of the price is above 4/8. It is the fine resistance line if the price is below this 4/8 line.


Share this

Risk disclosure:

No information on this site is investment advice or a solicitation to buy or sell any financial instrument. Past performance is not indicative of future results. Trading may expose you to risk of loss greater than your deposits and is only suitable for experienced investors who have sufficient financial means to bear such risk.

ProRealTime ITF files and other attachments : How to import ITF files into ProRealTime platform?

PRC is also on YouTube, subscribe to our channel for exclusive content and tutorials
  1. MonopolyTm • 10/04/2016 #

    Hello, Do you think it is possible to code something similar to the example in the following link?
    https://www.fxstreet.com/analysis/murray-math-analysis-gbp-usd-eur-cad-201707211405

  2. robertogozzi • 10/04/2016 #

    Why HAUT and BAS have been calculated AFTER line 8?
    Shouldn’t they be calculated BEFORE line 6?

avatar
Register or

Likes

avatar avatar avatar avatar avatar avatar avatar avatar avatar
Related users ' posts
Vonasi Discussion on this indicator/filter can be found here: https://www.prorealcode.com/topic/121...
Vonasi Forum discussion on these indicators can be found here: https://www.prorealcode.com/topic/av...
jennr29 Hi. Is it possible to convert this code to an mq4 file?
Nicolas Sorry but our website is dedicated to prorealtime programming. However, you can ask for priv...
TAC Bolsa All indicators share some code of other TAC indicators that improve the functioning of this ...
ramonjp Hi Tac, Great job. Please, can you provide latest code version of this indicator without ...
Tze Khai Lim Hi Tac, pls provide latest code version of this indicator. Thanks in advance.
snow_onar Very interesting indicator. Thanks for contributing it. What volume node or volume profile i...
m-zeter Hello Swingforfortune, would you like to share your code of the "greedzone" indicator?
floplouf bonjour, J'utilise cet indicateur qui m'est très utile. Mais, je n'arrive pas à créer d'ale...
Nicolas Merci d'ouvrir un sujet sur le forum pour cette demande spécifique.
Nicolas I changed the file, now it is all good.
JohnScher Thank you! Nicolas!
HeikinAshi looks interesting. can you say something about the variables? (L = 5 S = 95) are thos...
Appsoluxions Hi Nicolas, do you have the MT4 version of the indicator? I am not sure if these kind of que...
Nicolas Hi, don't have one sorry. But you can still ask for private coding through our programming s...
Appsoluxions Cool. Thanks for the response.
Domenec Hola Nicolas todo y el suavizado es como el awesome da ala señal 3 velas atrasada a veces de...
Lednora Bonjour à tous, Merci pour ce superbe indicateur! Est-il possible de rajouter une alerte su...
TAC Bolsa Estas equivocado al 99,9%. La correlación entre las series de precios y volúmenes las des...
Domenec Si hablas de un indice regional como el Ibex es posible que sea asi yo nunca lo he operado y...
TAC Bolsa Regional de Mostoles, en una cosa tienes razón mejor dejarlo aquí...
GUCCI ONE Bonjour, Nicolas. Pourriez-vous m'aider à transformer cet indicateur en screener, svp ? Merci
Nicolas disponible ici: https://www.prorealcode.com/topic/divergences-screener/
julien1978 hello to all, i recently discovered this indicator. would it be possible to add the detectio...
Domenec Claro Juanjo de todas maneras en deinversoratrader.com tienes estsos osciladores evolucionad...
Dron Hola Domenec, en la descripción hablas del indicador velas de colores, no lo encuentro en la...
Domenec Hola Dron mira en el blog deinversoratrader.com en formacion indicadores ahi hay varios grat...
Marcot18 Buonasera Maurinho, interessante l'indicatore che ha i proposto ma ancora di più interessant...
maurinho ciao marcot18 l'indicatore pubblico /proffessional lo puoi scaricare si chiama progo di will...
james effiong This strategy looks good
Nicolas
7 years ago
enricot Scusa nn riesco.
SoloContado If you smooth the signal using a "summation" function, you get a nice "crossing of 0" graph....
ShaunG Greatly appreciated Nicolas!
Gianluca ok i fixed it i hope is ok like this: //TAC trader zone 10.2 | indicator //01.01.2018 //R...
TAC Bolsa Hello try this new version or view the blog with the new indicators .. https://www.t...
TAC Bolsa Sorry, TAC Trader Zone V2 https://www.tiburonesdealetacorta.com/2018/11/indicador-tac-tr...
AGTrader Interesante, muy visual Doc. Felicidades!!!
Andraxx simplemente impresionante Dom...te sigo en youtube. Me ha gustado tu canal. Gracias por comp...
TACBOLSA
7 years ago
luxrun Thank you so much Tac BOLSA, I can not post the picture tonight I'll try tomorrow. I loaded ...
TAC Bolsa A new version of TAC Volume HPI DIV10.4 is available. that marks the divergence In the fo...
Raymundo Buenas tardes. Como puedo descargar algunos indicadores de esta pagina ?
Ravindra Khanna copied it to pro real time not working. what to do?
rama I want to use this indicator in trading system, it says zig zag is obsolete and not supported
Nicolas Right, due to its repainting behavior, the zigzag is not allowed in automated trading with r...
rama I noticed it changes as time progress, I am 7 as the average, how many period it wont chang...
mangiaragni Buongiorno io non riesco a visualizzare nessun tipo di volume , mi torna sempre una linea dr...
Nicolas Assicurati che lo strumento che stai guardando abbia dei volumi! È il caso?

Top