







My Stochastic Oscillator - John Ehlers
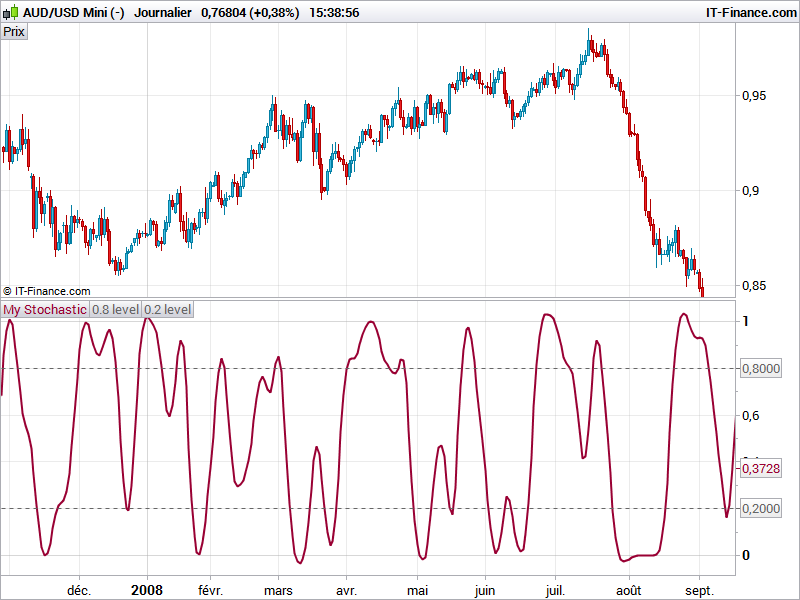
In his article, “Predictive And Successful Indicators,” author John Ehlers presents two new indicators: the SuperSmoother filter, which is superior to moving averages for removing aliasing noise, and the MESA Stochastic oscillator, a stochastic successor that removes the effect of spectral dilation through the use of a roofing filter.
To demonstrate the effects of using the new indicators, Ehlers introduces a simple countertrend system that goes long when MESA Stochastic crosses below the oversold value and reverses the trade by taking a short position when the oscillator exceeds the overbought threshold.
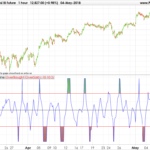
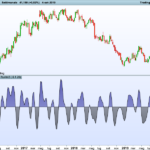
This stochastic oscillator eliminate noises a lot and then make reading of this oscillator more convenient with a clearer view. Because of smoothing / lag phenomena, this indicator must be used in convergence with other indicator to give good signals. Another ways of using it for counter trend trades would be to directly enter trade when the oscillator cross the oversold area for a buy order and the overbought area for a short sell order.
//PRC_MyStochastic J.Ehlers | indicator
//03.11.2016
//Nicolas @ www.prorealcode.com
//Sharing ProRealTime knowledge
//converted from EasyLanguage version

// --- parameters
Length = 20

if barindex>Length then
 //Highpass Filter cyclic components whose periods are shorter than 48 bars
 alpha1 = (Cos(.707*360 / 48) + Sin(.707*360 / 48) - 1) / Cos(.707*360 / 48)
 HP = (1 - alpha1 / 2)*(1 - alpha1 / 2)*(Close - 2*Close[1] + Close[2]) + 2*(1 - alpha1)*HP[1] - (1 - alpha1)*(1 - alpha1)*HP[2]

 //Smooth with a Super Smoother Filter
 a1 = exp(-1.414*3.14159 / 10)
 b1 = 2*a1*Cos(1.414*180 / 10)
 c2 = b1
 c3 = -a1*a1
 c1 = 1 - c2 - c3
 Filt = c1*(HP + HP[1]) / 2 + c2*Filt[1] + c3*Filt[2]

 HighestC = Filt
 LowestC = Filt

 For count = 0 to Length - 1 do
  If Filt[count] > HighestC then
   HighestC = Filt[count]
  endif
  If Filt[count] < LowestC then
   LowestC = Filt[count]
  endif
 Next

 Stoc = (Filt - LowestC) / (HighestC - LowestC)
 MyStochastic = c1*(Stoc + Stoc[1]) / 2 + c2*MyStochastic[1] + c3*MyStochastic[2]
endif

RETURN MyStochastic as "My Stochastic", 0.8 as "0.8 level", 0.2 as "0.2 level"
Comments
You must be logged in to post a comment.

Hi, I'm quite late in this thread. I'd just like to propose an enhancement because this indicator turns out to be really to compute, specially if doing some back-testing. The idea simply is to replace the looping part with some native function which are quicker, and to do constants calculation just once... Here's the code... Once alpha1 = (Cos(.707*360 / 48) + Sin(.707*360 / 48) - 1) / Cos(.707*360 / 48) Once a1 = exp(-1.414*3.14159 / 10) Once b1 = 2*a1*Cos(1.414*180 / 10) Once c2 = b1 Once c3 = -a1*a1 Once c1 = 1 - c2 - c3 if barindex>Length then //Highpass Filter cyclic components whose periods are shorter than 48 bars HP = (1 - alpha1 / 2)*(1 - alpha1 / 2)*(Close - 2*Close[1] + Close[2]) + 2*(1 - alpha1)*HP[1] - (1 - alpha1)*(1 - alpha1)*HP[2] //Smooth with a Super Smoother Filter Filt = c1*(HP + HP[1]) / 2 + c2*Filt[1] + c3*Filt[2] HighestC = highest[Length - 1](Filt) LowestC = lowest[Length - 1](Filt) Stoc = (Filt - LowestC) / (HighestC - LowestC) MyStochastic = c1*(Stoc + Stoc[1]) / 2 + c2*MyStochastic[1] + c3*MyStochastic[2] endif RETURN MyStochastic as "My Stochastic", 0.8 as "0.8 level", 0.2 as "0.2 level"


Hi Nicolas,
Thanks for your help with the Monte Carlo links and these Ehler's indicators, they really are good, particularly the Universal Oscillator with 0.7 and -0.7 crosses using a trend definition like two 200 mov averages, the present compared to it's 5 or 10 day previous value to determine trade direction and using a shorter period exit stop. Oddly Cythia Kase's Dev Stops didn't seem to work as well... I will test the Univ. Osc with the Kaufman KAMA soon.
I'm going to see how they then compare with the Goertzel Algo if I can ever get those indicators to load properly without "syntax issues... The function called from Example A, called from Example B, is called with 1 parameter(s) instead of 0 expected. "? I think I'm, missing an indicator - pls see screenshot: The image isn't showing as attached to this comment? I will try again below this comment if necessary.
I'm trying to figure out though how you determine the best bandedge setting for the Universal Oscillator? It'd be great if it could have been an optimised parameter so it could then be optimised and "let loose" on an out of sample data set. Is there a simple way like trying to match the oscillations to the price/chart oscillations?
Cheers
Brad
Hi Nicolas, Thanks for posting Ehler's My Oscillator (a combination of his Optimal Tacking Filter and the Universal Oscillator (Supersmoother)), I just saw your MESA stochastic for prorealtime post
#15940.
You mentioned "This indicator reflects short term variations of price within the "bandedge" parameter as a frequency" on the Universal Oscillator page. What does that exactly mean?
I was also wondering how best to determine what Bandedge setting to use in Ehler's Oscillators, or is it a case of optimising it for one currency pair and then seeing how it performs for other pairs?
Re: Trading systems, I'm still working with different Ehler indicators. When the Supersmoother Oscillator is set to be >= the zero line as a long entry (and <= for short trades) using a Kaufman KAMA as the exit long
(Period = 4, FastPeriod = 2, SlowPeriod = 30) works well on different markets like forex, gold, even Credit Agricole. As usual it is a balancing act with getting acceptable lower drawdowns with the % winner and a good gain/loss ratio.
Is there any way to do Monte Carl testing of results, fortunately it's built into the Trading Blox s/ware I have but I didn't manage to figure out how to use the Excel s/ware approach?
Cheers again for your help.
Nice to hear you make good trades with Ehler's indicators so far. About the "bandedge" statement, where did I mentioned that? About Monte Carlo analysis, there are already good threads on forums to make your excel report of prorealtime backtest results: http://www.prorealcode.com/topic/monte-carlo-analysis/ http://www.prorealcode.com/topic/montecarlo/

Hi Nicolas, I wanted to make this scaled indicator above between -1 and +1 instead of 0 to +1. What's the best way to do that please as I tried multiplying MyStochastic by 2 and didn't get a full range of values for the -1 to 0 range? Pls see image and top indicator: https://www.dropbox.com/s/hsimnthu4kmjw4f/scalingoscillator.png I wanted to compare the effects of the roofing filter in this indicator with the results from Ehler's Universal Oscillator (no roofing filter) which is set as a histogram plotted between -1 and +1. It's easier for visual comparison, although of course it's still possible with this line based oscillator version. Cheers.