







myCandel Infos
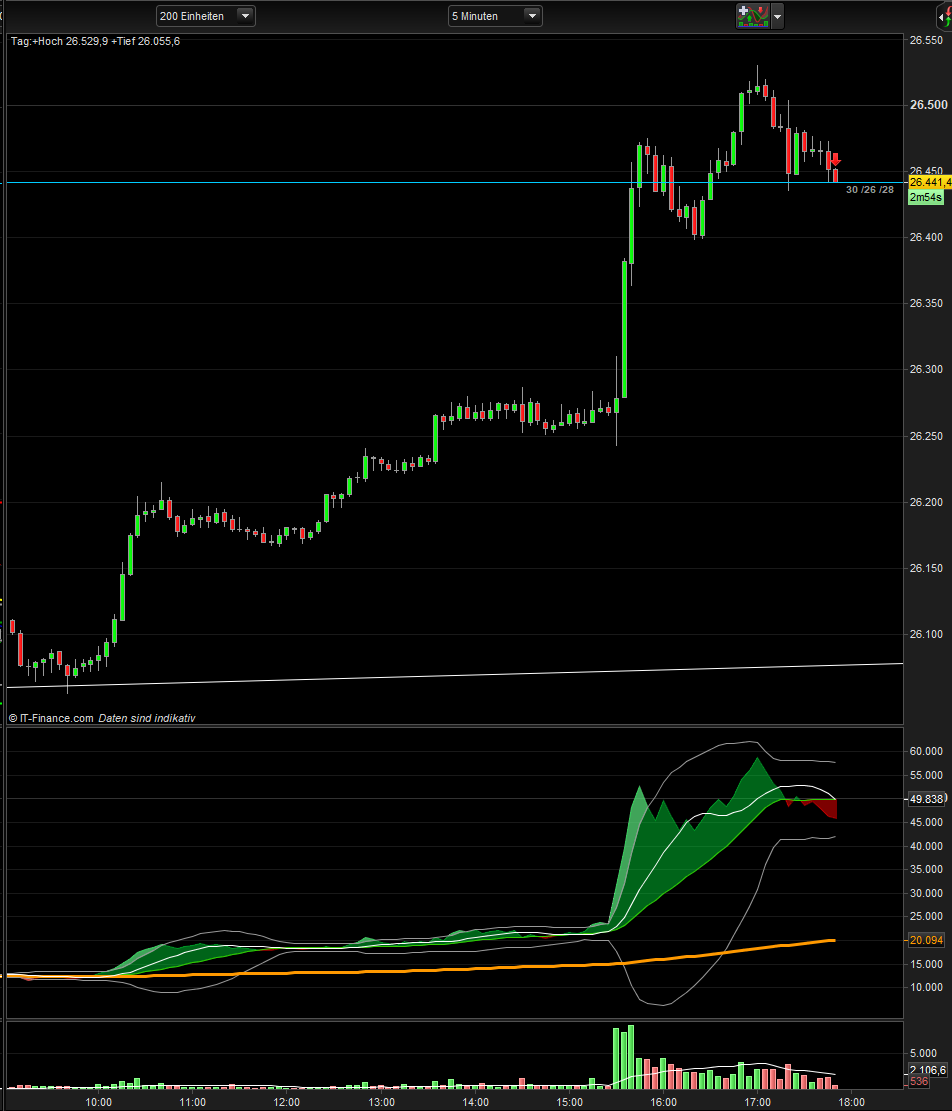
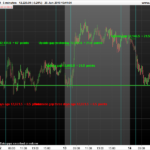
Shows the previous Candelrange, ATR[10] and EMA[20] of ATR[10] near candle in two different colours.
Colour change when ATR is over EMA to orange. When range over atr and atr over ema possible stronger moves/volatility.
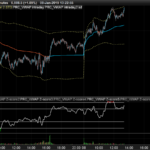
Shows Arrows for Long and Short recommendation depend on Priceaction and OBV.
You can select which info you want.
18.06.2019 (Release 1.0)
// myCandel
// Shows the Candelrange, ATR and EMA-ATR near candel in two different colours.
// Schows Arrows for Long and Short recommendation depend on Priceaction and OBV.
// 18.06.2019 (Release 1.0)
// Thomas Geisler
// Sharing ProRealTime knowledge

defparam drawonlastbaronly=true // Zeichung nur am letzten Bar

//--settings
info = 1
arrows = 1
//--end

//--init--
alpha = 255
PIP=pipsize*2
//--end--

// --Info
// Vorherige Range[1] und ATR[10] / EMA-ATR[20]Berechnung
myRange = round(Range[1])
myATR = round(AverageTrueRange[10](close[0]))
myEATR = round(ExponentialAverage[20](AverageTrueRange[10](close[0])))
// Anzeige der aktuellen Range / ATR / EMA ATR. Orange wenn über dem Durchschnitt
If Info = 1 then
 if myATR < ExponentialAverage[20](myATR) then
  DrawText("                        #myRange#/#myATR#/#myEATR#",barindex,close-5,SansSerif,Bold,10) coloured(153,153,153,alpha)
 else
  DrawText("                        #myRange#/#myATR#/#myEATR#",barindex,close-5,SansSerif,Standard,10) coloured(255,153,0,alpha)
 endif
endif

// -- Arrows
//Trend bzw Trendstärke ermitteln
// Bestimmung der Stärke eines bullischen Trends
BullTrend = (Close - LOWEST[20](LOW)) / AVERAGETRUERANGE[10]
// Bestimmung der Stärke eines bearischen Trends
BearTrend = (HIGHEST[20](HIGH) - Close) / AVERAGETRUERANGE[10]
// Angleichen
Trend = (BullTrend - BearTrend)
TrendEMA = ExponentialAverage[20](Trend)

// On Balance Volumen zur Bestimmung der Kaufkraft der Bewegung/Trend
myOBV = OBV
myOBVA1 = Average[20](myOBV)
myOBVA2 = Average[10](myOBV)

if Arrows = 1 then
 If Trend > TrendEMA and myOBV > myOBVA1 and myOBV > myOBVA2 then
  DRAWARROWup(barindex,low-PIP) coloured(0,255,0,alpha)
 elsif Trend < TrendEMA and myOBV < myOBVA1 and myOBV < myOBVA2 then
  DRAWARROWdown(barindex,high+PIP)coloured(255,0,0,alpha)
 endif
endif

Return
Comments
You must be logged in to post a comment.


Traducción de Google del alemán: Estoy buscando movimientos fuertes. Si el ATR es más grande que su promedio y el tamaño de la vela es más grande que el ATR, tengo movimientos rápidos. Por ejemplo, 12/10/9: La vela tiene 12 puntos, el ATR 10 y el promedio de 9. Las flechas verde y roja me muestran que el movimiento también es compatible con el volumen. Como dirección de tendencia se puede utilizar, por ejemplo, el VWAP. Google translation from German: I am looking for strong movements. If the ATR is larger than its average and the size of the candle is larger than the ATR, I have fast movements. For example, 12/10/9: The candle has 12 points, the ATR 10 and the average 9. The green and red arrows show me that the movement is also supported by the volume. As trend direction one can use for example the VWAP.


Please advise what is the repair to the code. Not working.

OLA NAO SERVE PARA MT4?