The N Reversal Detector is a technical indicator developed to detect market trend reversal points. This indicator combines multiple approaches to identify both trends and potential market reversals, integrating the use of moving averages, the Supertrend indicator, and Donchian Channels. Its primary goal is to alert traders of potential changes in market direction, both in bullish and bearish trends.
Unlike other indicators that focus on a single method to identify market direction, the N Reversal Detector uses a multi-filter system. Depending on the selected configuration, the indicator can identify aligned or opposing trends, providing clear signals for traders looking for entries based on trend reversals.
In addition to filtering trends, the indicator also implements a reversal pattern detection system for both bullish and bearish reversals, making it highly versatile for use in multiple trading styles, whether on daily, intraday, or long-term charts.
Key Features:
- Uses multiple trend filters (moving averages, Supertrend, and Donchian Channels).
- Detects three-bar reversal patterns.
- Provides clear visual signals for trading decisions.
- Highly configurable, allowing adjustments according to the trader’s strategy.
2. Indicator Components
The N Reversal Detector consists of several key elements that work together to identify trends and potential reversal points. Below are the main components of the indicator:
2.1 Trend Filters
The indicator offers three types of trend filters that can be selected through the trendType variable. These filters allow you to adjust how the indicator detects trends and how it interprets reversal signals:
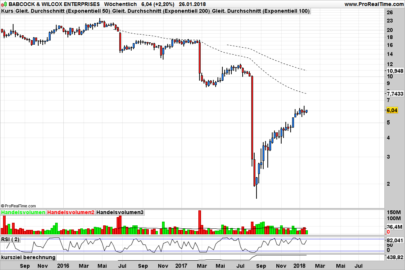
- Moving Average (MA Trend): This filter uses two moving averages of different lengths to identify the trend. When the fast moving average (shorter period) is above the slow moving average (longer period), it is considered a bullish trend, and vice versa for a bearish trend.
- Variables:
maFlength(default 50): Length of the fast moving average.maSLength(default 200): Length of the slow moving average.maType(default 7): Type of moving average (e.g., simple, exponential, etc.).
- Variables:
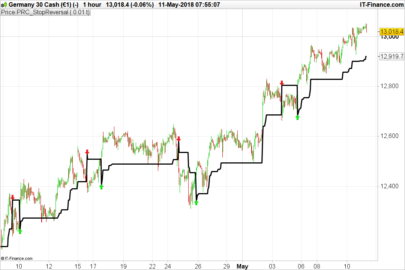
- Supertrend (ST Trend): Uses the Supertrend indicator, which is based on the Average True Range (ATR) to determine whether the market is in a bullish or bearish trend. The Supertrend bands adjust according to volatility, making it particularly useful in volatile markets.
- Variables:
atrPeriod(default 10): Period for the ATR.factor(default 3): Multiplier for the ATR to determine trend bands.
- Variables:
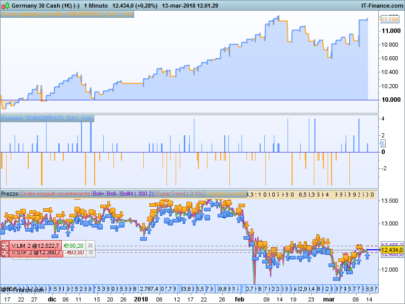
- Donchian Channels (Donchian Trend): This filter uses the highs and lows over a specified period to identify the trend. If prices are hitting new highs or lows, the trend is detected in that direction.
- Variables:
length(default 13): Period for the Donchian Channels.
- Variables:
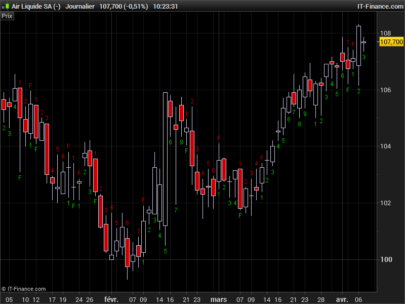
2.2 Reversal Pattern Detection
The indicator includes a reversal pattern detection module based on the last three bars of the chart. This module identifies conditions where the price has reached an extreme (high or low) and has started to reverse:
- Bullish Reversal: A bullish reversal pattern is detected when the price has consistently dropped over several bars and begins to show signs of recovery. To confirm the bullish signal, the indicator also checks whether the overall trend supports the reversal.
- Variables:
numBars(default 7): Number of bars used to detect the pattern.minBars(default 50): Minimum percentage of bearish bars required to validate the reversal.
- Variables:
- Bearish Reversal: Similar to the bullish reversal, this pattern identifies situations where the price has steadily risen and begins to retrace. It also requires that the overall trend is bearish to confirm the signal.
- Variables:
numBarsandminBarsare also used for bearish reversals.
- Variables:
2.3 Trend Filter
The TrendFilter parameter is used to further refine the signals generated by the indicator. This filter allows the user to choose whether reversal signals should align with the overall trend or if they can be contrary:
- TrendFilter enabled (
True): Reversal signals are only generated when they align with the prevailing trend (bullish for bullish signals and bearish for bearish signals). - TrendFilter disabled (
False): Reversal signals are allowed even if they are contrary to the main trend, which may generate more signals but also increases the risk of false alarms.
3. Indicator Configuration
The N Reversal Detector offers a range of adjustable parameters that allow users to tailor the indicator’s behavior to their preferences and trading strategies. Below are the main configuration variables and how they affect the indicator’s performance.
3.1 Input Variables
trendType(default 0): Defines the type of trend filter to use.- 0: No trend filter. The indicator will detect reversal signals without considering the overall market trend.
- 1: Filter based on moving averages (MA).
- 2: Filter based on the Supertrend indicator (ST).
- 3: Filter based on Donchian Channels.
TrendFilter(default 1): Controls whether signals should align with the detected trend.- 1 (True): Only signals aligned with the trend will be allowed.
- 0 (False): Reversal signals are allowed even if they go against the main trend.
- Moving Averages:
maFlength(default 50): Defines the period for the fast moving average.maSLength(default 200): Defines the period for the slow moving average.maType(default 7): Determines the type of moving average (simple, exponential, etc.).
- Supertrend:
atrPeriod(default 10): Number of periods used to calculate the Average True Range (ATR), which is key for determining the Supertrend bands.factor(default 3): Multiplier applied to the ATR to set the Supertrend bands.
- Donchian Channels:
length(default 13): Number of bars used to calculate the highs and lows for the Donchian channel.
- Reversal Pattern Detection:
numBars(default 7): Number of bars analyzed to detect a bullish or bearish reversal. A higher number of bars provides more conservative signals.minBars(default 50): Defines the minimum percentage of bars that must be bullish or bearish for the reversal pattern to be considered valid.
3.2 Parameter Adjustments
The N Reversal Detector is highly customizable, meaning traders can adjust the parameters according to market conditions or their risk preferences. Below are some common adjustment examples:
- Moving Average Trend: If the trader prefers to use moving averages to define the trend, they can select
trendType = 1and adjustmaFlengthandmaSLengthaccording to the timeframe they are analyzing. For intraday charts, it may be more effective to reduce the moving averages periods (e.g.,maFlength = 20andmaSLength = 50). - Supertrend for Volatile Markets: In highly volatile markets, the Supertrend can provide more dynamic signals. In this case, adjusting
atrPeriod = 14andfactor = 2can help produce tighter bands that react to price fluctuations. - Donchian Channels for Range-Bound Markets: If the market is in a sideways range, using the Donchian Channels (
trendType = 3) may be more appropriate. Adjusting thelengthto 20 or more can help capture significant breakout movements.
3.3 Usage Considerations
- No Trend Filter: For traders who prefer to trade against the trend or look for quick reversals, they can disable the trend filters by selecting
trendType = 0andTrendFilter = 0. This will generate more signals but may increase the number of false signals. - Trend Alignment: If the priority is to trade in the direction of the prevailing trend, it is advisable to keep
TrendFilter = 1. This will reduce the number of signals generated but increase the likelihood that they are reliable.
4. How the Indicator Works
The N Reversal Detector works by combining different technical analysis techniques to detect both trends and potential reversals. In this section, we will break down the code to explain how buy and sell signals are generated and how the different components of the indicator interact.
4.1 Trend Filters
4.1.1 Moving Average
When trendType = 1 is selected, the indicator uses two moving averages to identify the trend:
- Fast moving average (
maFast): Calculated with themaFlengthparameter, which defines the number of periods. - Slow moving average (
maSlow): Calculated with themaSLengthparameter.
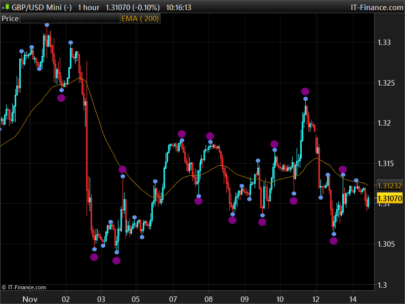
If the fast moving average (maFast) is above the slow moving average (maSlow), it is considered a bullish trend, and an area between the two moving averages is colored in green (RGB: 8, 153, 129). Otherwise, it is considered a bearish trend, and the area is colored in red (RGB: 242, 54, 69).
|
1 2 3 4 5 6 7 8 9 10 11 12 |
if trendType=1 then if maFast>maSlow then r=8 g=153 b=129 else r=242 g=54 b=69 endif colorbetween(maFast,maSlow,r,g,b,20) endif |
This code draws the area between the two moving averages using colors to indicate whether the trend is bullish or bearish, enhancing trend visualization on the chart.
4.1.2 Supertrend
With trendType = 2, the Supertrend indicator is activated, which uses the ATR (Average True Range) to calculate trend bands:
- Upper band (
up): Calculated by subtracting the ATR multiplied by the adjustment factor (factor) from the bar’s high. - Lower band (
dn): Calculated by adding the ATR multiplied by thefactorto the bar’s low.
|
1 2 3 |
atr = averagetruerange[atrPeriod](close) up = high - factor*atr dn = low + factor*atr |
The Supertrend follows the price action, adjusting dynamically according to volatility. If the current price crosses above the upper band, it is considered a bullish trend, while crossing below the lower band indicates a bearish trend.
|
1 2 3 4 5 6 7 8 9 10 11 12 13 14 15 |
if trendType=2 then if trend = 1 then mysupertrend = up r=8 g=153 b=129 else mysupertrend = dn r=242 g=54 b=69 endif bodyMiddle=(open+close)/2 colorbetween(mysupertrend,bodyMiddle,r,g,b,25) endif |
Here, the indicator colors the area between the Supertrend line and the close price to visualize the prevailing trend.
4.1.3 Donchian Channels
When trendType = 3 is selected, the indicator uses Donchian Channels, which plot the highest and lowest values over a period defined by the length parameter to determine whether there is a bullish or bearish trend.
|
1 2 |
upper = highest[length](close) lower = lowest[length](close) |
If the price is reaching new highs, the indicator detects a bullish trend; if it is reaching new lows, it detects a bearish trend. Like the other trend filters, the area between the Donchian channel lines is colored using green for bullish trends and red for bearish trends.
|
1 2 3 4 5 6 7 8 9 10 11 12 13 14 15 16 17 |
if trendType=3 then once os=0 if upper>upper[1] then os=1 r=8 g=153 b=129 elsif lower<lower[1] then os=0 r=242 g=54 b=69 else os=os endif colorbetween(upper,lower,r,g,b,20) endif |
4.2 Reversal Pattern Detection
4.2.1 Bullish Reversal
The indicator looks for a bullish reversal pattern based on the last numBars bars. It evaluates whether the price has consistently dropped and has started to reverse. A minimum percentage of bearish bars (defined by minBars) is required to validate the pattern.
4.2.2 Bearish Reversal
The process for detecting a bearish reversal is similar, but this time the indicator looks for a series of bullish bars followed by a reversal to the downside.
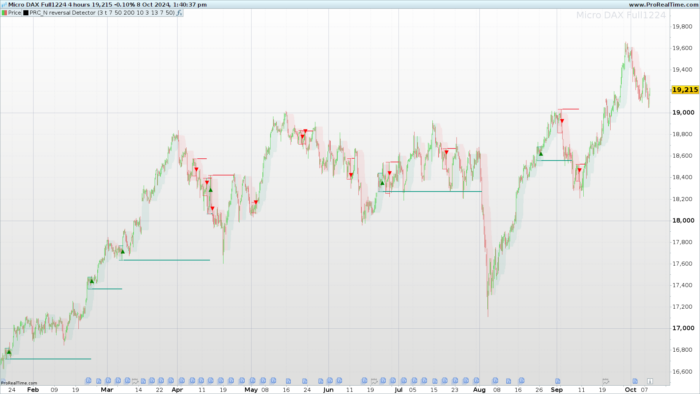
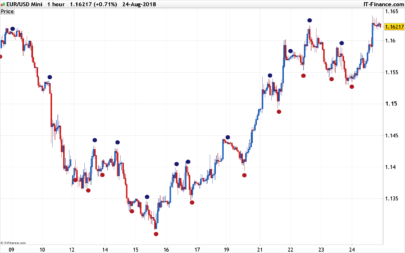
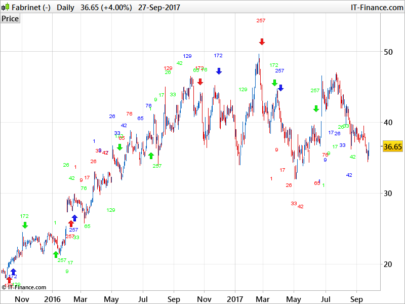
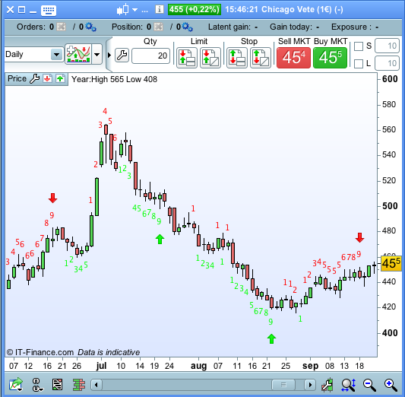
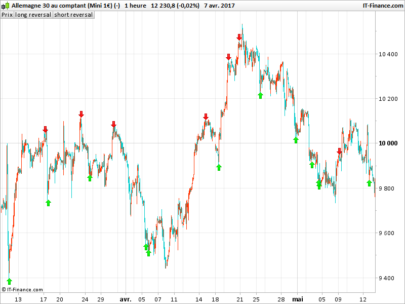
4.3 Visual Signals on the Chart
When a bullish or bearish reversal is confirmed, the indicator plots the corresponding signals on the chart, along with lines and rectangles highlighting key support and resistance levels.
- Bullish Signals:
12345678if bullishReversal and bullishReversal[1]=0 thendrawtext("▲",barindex,low)coloured("green")drawsegment(lnATx,lnAT,barindex,lnAT)coloured(8,153,129)style(line,1)drawsegment(lnATx,bullLow,barindex,bullLow)coloured(8,153,129)style(line,1)drawrectangle(lnATx,bullLow,barindex,lnAT)coloured(8,153,129,0)fillcolor(8,153,129,25)endif
- Bearish Signals:
12345678if bearishReversal and bearishReversal[1]=0 thendrawtext("▼",barindex,high)coloured("red")drawsegment(lnSBx,lnSB,barindex,lnSB)coloured(242,54,69)drawsegment(lnSBx,bearHigh,barindex,bearHigh)coloured(242,54,69)drawrectangle(lnSBx,bearHigh,barindex,lnSB)coloured(242,54,69,0)fillcolor(242,54,69,25)endif
5. Conclusion
The N Reversal Detector is a versatile and comprehensive indicator designed to detect both bullish and bearish reversals using a combination of trend filters and price patterns. This indicator allows traders to adapt their analysis to different market conditions, whether the market is trending or range-bound.
Key features of the indicator include:
- Trend Filters: Moving averages, Supertrend, and Donchian Channels, allowing traders to adjust trend detection based on their preferences.
- Reversal Pattern Detection: Identifies potential trend changes based on customizable settings that analyze recent bar behavior.
- Flexibility: The indicator is highly configurable, allowing users to adjust parameters like moving average lengths, ATR periods, and trend filters to optimize it for their strategy.
- Clear Visual Signals: Buy and sell signals are clearly displayed on the chart, helping traders make quick and accurate decisions.
In summary, the N Reversal Detector is a powerful tool for traders seeking to identify entry and exit points based on potential trend reversals, and who require flexibility to tailor the indicator to various market conditions.
|
1 2 3 4 5 6 7 8 9 10 11 12 13 14 15 16 17 18 19 20 21 22 23 24 25 26 27 28 29 30 31 32 33 34 35 36 37 38 39 40 41 42 43 44 45 46 47 48 49 50 51 52 53 54 55 56 57 58 59 60 61 62 63 64 65 66 67 68 69 70 71 72 73 74 75 76 77 78 79 80 81 82 83 84 85 86 87 88 89 90 91 92 93 94 95 96 97 98 99 100 101 102 103 104 105 106 107 108 109 110 111 112 113 114 115 116 117 118 119 120 121 122 123 124 125 126 127 128 129 130 131 132 133 134 135 136 137 138 139 140 141 142 143 144 145 146 147 148 149 150 151 152 153 154 155 156 157 158 159 160 161 162 163 164 165 166 167 168 169 170 171 172 173 174 175 176 177 178 179 180 181 182 183 184 185 186 187 188 189 190 191 192 193 194 195 196 197 198 199 200 201 202 203 204 205 206 207 208 209 210 211 212 213 214 215 216 217 218 219 220 221 222 223 224 225 226 227 228 229 230 231 232 233 234 235 236 237 238 239 240 241 242 243 244 245 246 247 248 249 250 251 252 253 254 255 256 257 258 259 260 261 262 263 264 265 266 267 268 269 270 271 272 273 274 275 276 277 278 |
//---------------------------------------------------// //PRC_N reversal Detector //version = 0 //04.10.2024 //Iván González @ www.prorealcode.com //Sharing ProRealTime knowledge //---------------------------------------------------// //------------------Inputs---------------------------// //---------------------------------------------------// //Trend filetering trendType=0 //0=no trend / 1=MA trend / 2=ST trend / 3=Donchian trend TrendFilter=1 // True=Aligned / False=Opposite //Moving average settings maType=7 maFlength=50 maSLength=200 //Supertrend settings atrPeriod=10 factor=3 //Donchian Channels settings length=13 //Pattern Detection numBars=7 minBars=50 //---------------------------------------------------// //-----Trend indicators - Moving average Cloud-------// //---------------------------------------------------// maFast=average[maFlength,maType](close) maSlow=average[maSLength,maType](close) if trendType=1 then if maFast>maSlow then r=8 g=153 b=129 else r=242 g=54 b=69 endif colorbetween(maFast,maSlow,r,g,b,20) endif //---------------------------------------------------// //---------Trend indicators - Supertrend-------------// //---------------------------------------------------// atr = averagetruerange[atrPeriod](close) up = high - factor*atr up1 = up[1] if close[1] > up1 then up = max(up,up1) else up = up endif dn = low + factor*atr dn1 = dn[1] if close[1] < dn1 then dn = min(dn,dn1) else dn = dn endif once trend = 1 if trend = -1 and close > dn1 then trend = 1 elsif trend = 1 and close < up1 then trend = -1 else trend = trend endif if trendType=2 then if trend = 1 then mysupertrend = up r=8 g=153 b=129 else mysupertrend = dn r=242 g=54 b=69 endif bodyMiddle=(open+close)/2 colorbetween(mysupertrend,bodyMiddle,r,g,b,25) endif //---------------------------------------------------// //------Trend indicators - Donchian Channels---------// //---------------------------------------------------// upper=highest[length](close) lower=lowest[length](close) if trendType=3 then once os=0 if upper>upper[1] then os=1 r=8 g=153 b=129 elsif lower<lower[1] then os=0 r=242 g=54 b=69 else os=os endif colorbetween(upper,lower,r,g,b,20) endif //---------------------------------------------------// //--------------3-Bar Reversal Pattern---------------// //---------------------------------------------------// if trendType=1 then if TrendFilter=1 then CDownTrend= close<maFast and maFast<maSlow CUpTrend= close>maFast and maFast>maSlow elsif TrendFilter=0 then CDownTrend=close>maFast and maFast>maSlow CUpTrend=close<maFast and maFast<maSlow else CDownTrend=1 CUpTrend=1 endif elsif trendType=2 then if TrendFilter=1 then CDownTrend= trend=-1 CUpTrend= trend=1 elsif TrendFilter=0 then CDownTrend=trend=1 CUpTrend=trend=-1 else CDownTrend=1 CUpTrend=1 endif elsif TrendType=3 then if TrendFilter=1 then CDownTrend=os=0 CUpTrend=os=1 elsif TrendFilter=0 then CDownTrend=os=1 CUpTrend=os=0 else CDownTrend=1 CUpTrend=1 endif else CDownTrend=1 CUpTrend=1 endif //---------------------------------------------------// //----------Bullish Reversal Detection---------------// //---------------------------------------------------// bullReversal=0 bullLow=low[numBars] bearCount=0 for i=1 to numBars-1 do if high[i]>high[numBars] then bullReversal=0 break else bullReversal=1 bullLow=min(bullLow,low[i]) if open[i]>close[i] then bearCount=1+bearCount endif endif next if bearCount/(numBars-1)>= minBars/100 then bullReversal=1 else bullReversal=0 endif bullLow=min(bullLow,low) isBullish=bullReversal and high>high[numBars] bullishReversal=isBullish and CUpTrend //---------------------------------------------------// //----------Bearish Reversal Detection---------------// //---------------------------------------------------// bearReversal=0 bearHigh=high[numBars] bullCount=0 for i=1 to numBars-1 do if low[i]<low[numBars] then bearReversal=0 break else bearReversal=1 bearHigh=max(bearHigh,high[i]) if open[i]<close[i] then bullCount=1+bullCount endif endif next if bullCount/(numBars-1)>= minBars/100 then bearReversal=1 else bearReversal=0 endif bearHigh=max(bearHigh,high) isBearish=bearReversal and low<low[numBars] bearishReversal=isBearish and CDownTrend //---------------------------------------------------// //-----------------Plot Signals----------------------// //---------------------------------------------------// //Bullish conditions if bullishReversal and bullishReversal[1]=0 then prevlnABx=lnABx prevlnAB=lnAB lnAT=high[numbars] lnATx=barindex[numbars] lnAB=bullLow lnABx=barindex bullProcess=1 drawtext("▲",barindex,low)coloured("green") drawsegment(lnATx,lnAT,barindex,lnAT)coloured(8,153,129)style(line,1) drawsegment(lnATx,bullLow,barindex,bullLow)coloured(8,153,129)style(line,1) drawrectangle(lnATx,bullLow,barindex,lnAT)coloured(8,153,129,0)fillcolor(8,153,129,25) if lowLevelbreaken=0 then drawsegment(prevlnABx+1,prevlnAB,barindex[1],prevlnAB)style(line,2)coloured(8,153,129) endif lowLevelbreaken=0 endif if bullProcess=1 then if close[1]<lnAB and lowLevelbreaken=0 then lowLevelbreaken=1 drawsegment(lnABx+1,lnAB,barindex[1],lnAB)style(line,2)coloured(8,153,129) bullprocess=0 endif endif //---------------------------------------------------// //Bearish conditions if bearishReversal and bearishReversal[1]=0 then prevlnSTx=lnSTx prevlnST=lnST lnSB=low[numbars] lnSBx=barindex[numbars] lnST=bearHigh lnSTx=barindex bearProcess=1 drawtext("▼",barindex,high)coloured("red") drawsegment(lnSBx,lnSB,barindex,lnSB)coloured(242,54,69) drawsegment(lnSBx,bearHigh,barindex,bearHigh)coloured(242,54,69) drawrectangle(lnSBx,bearHigh,barindex,lnSB)coloured(242,54,69,0)fillcolor(242,54,69,25) if HighLevelbreaken=0 then drawsegment(prevlnSTx+1,prevlnST,barindex[1],prevlnST)style(line,2)coloured(242,54,69) endif HighLevelbreaken=0 endif if bearProcess=1 then if close[1]>lnST and HighLevelbreaken=0 then HighLevelbreaken=1 drawsegment(lnSTx+1,lnST,barindex[1],lnST)style(line,2)coloured(242,54,69) bearProcess=0 endif endif //---------------------------------------------------// return |
Share this
No information on this site is investment advice or a solicitation to buy or sell any financial instrument. Past performance is not indicative of future results. Trading may expose you to risk of loss greater than your deposits and is only suitable for experienced investors who have sufficient financial means to bear such risk.
ProRealTime ITF files and other attachments :
Find other exclusive trading pro-tools on ![]()
PRC is also on YouTube, subscribe to our channel for exclusive content and tutorials


Bonjour, qu’est-ce qu’un fichier itf ? Comment ça marche ?
Hola, ¿qué es un archivo itf? ¿Cómo funciona?