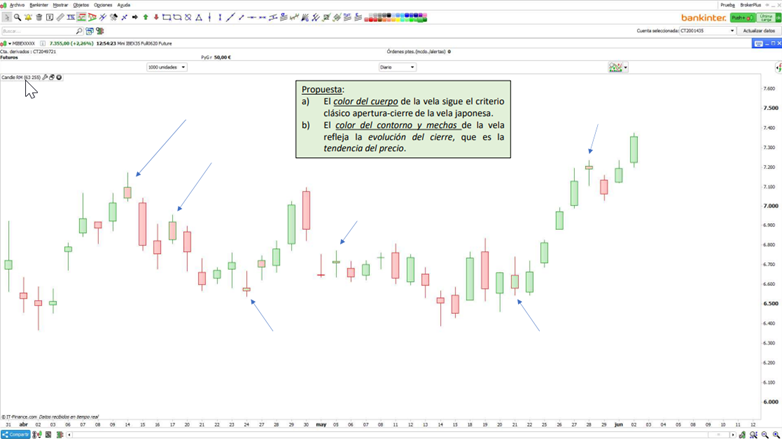
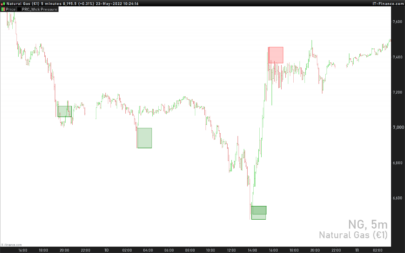
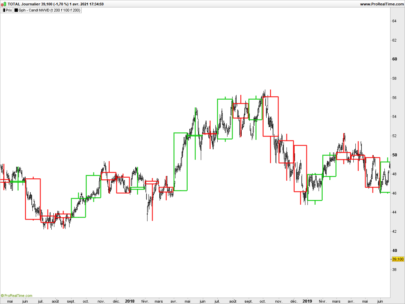
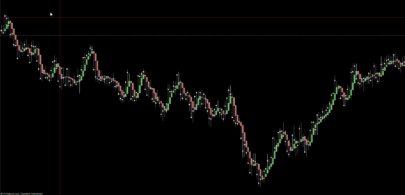
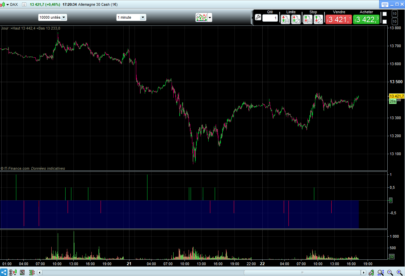
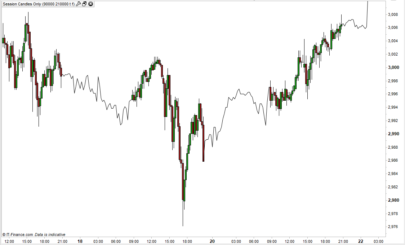
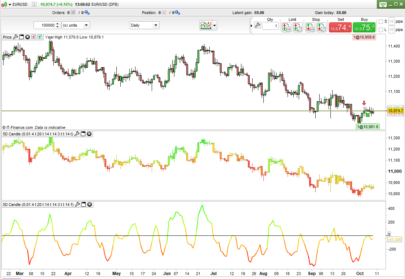
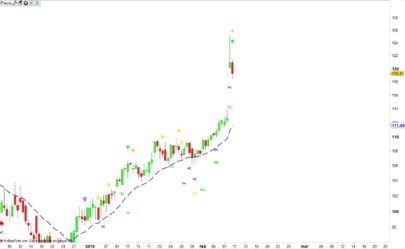
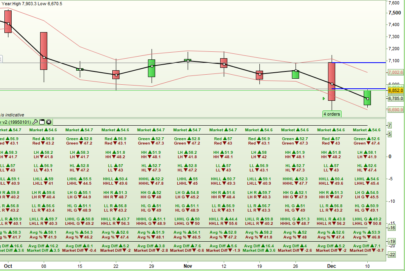
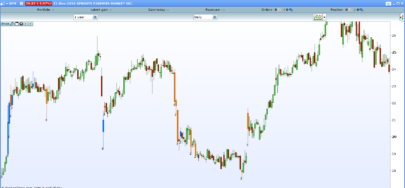
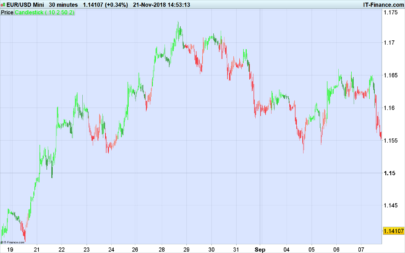
Candle RM is a technical indicator to be used in the technical analysis of financial markets. This proposed candle is a variant of the traditional Japanese candle, but also including color information about the variation from the previous CLOSURE (not included in the Japanese candle).
Rules:
a) The color of the body of the candle follows the classic open-close criteria of Japanese candle.
b) The color of the outline and wicks of the candle indicates the change in closure from its previous value, which is the price trend. The Candle RM was developed by R. Monterreal (December 2019)
The conventional Japanese candle has for me (if it can be called that) a slight deficiency: the color code, it does not “graphically” show the inter-day evolution of the price, but only the intra-day difference between opening and closing. Someone will say (and rightly so) that the relative position of a candle relative to the previous one already shows the trend followed by the price. However, in sails with close inter-day closings (or lateral movements) the conventional color coding can slightly disorient the trader, especially beginners. I attach a proposal for a graphic variant on the classic Japanese candle that solves this. It is applicable intraday and easy to program.
|
1 2 3 4 5 6 7 8 9 10 11 12 13 14 15 16 17 18 19 20 21 22 23 24 25 26 27 28 29 30 31 32 33 34 35 36 37 38 39 40 41 42 43 44 |
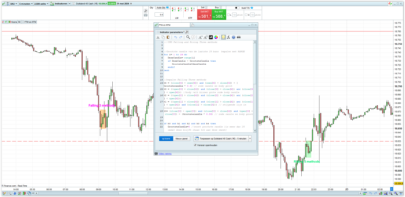
REM Candlestick RM REM Variant of the traditional Japanese candle that includes in the color code the variation from the previous CLOSE. This colour code affects the contour of the body of the candle and its wicks. REM By R. Monterreal, Dic-2019 // Parameters, in order to increase color contrast between candle body and border colour // alfa: in DRAWCANDLE it is the transparency of the color of the candle body COLOURED(R,G,B,alfa) // beta: in DRAWCANDLE it is the transparency of the BORDERCOLOR(R,G,B,beta) //------------------------ // Useful things: // A) WhiteCandle = Open < Close BlackCandle = Open > Close DojiCandle = Open = Close // B) PriceUP = Close[0] > Close[1] PriceDown = Close[0] < Close[1] PriceDoji = Close[0] = Close[1] //------------------------ // Casuistica if WhiteCandle AND PriceUP then DRAWCANDLE(Open,High,Low,Close) COLOURED(0,153,0, alfa) BORDERCOLOR(0,153,0,beta) elsif BlackCandle AND PriceUP then DRAWCANDLE(Open,High,Low,Close) COLOURED(255,0,0, alfa) BORDERCOLOR(0,153,0,beta) elsif DojiCandle AND PriceUP then DRAWCANDLE(Open,High,Low,Close) COLOURED(0,0,0, alfa) BORDERCOLOR(0,153,0,beta) //.............................. elsif BlackCandle AND PriceDown then DRAWCANDLE(Open,High,Low,Close) COLOURED(255,0,0, alfa) BORDERCOLOR(255,0,0,beta) elsif WhiteCandle AND PriceDown then DRAWCANDLE(Open,High,Low,Close) COLOURED(0,153,0, alfa) BORDERCOLOR(255,0,0,beta) elsif DojiCandle AND PriceDown then DRAWCANDLE(Open,High,Low,Close) COLOURED(0,0,0, alfa) BORDERCOLOR(255,0,0,beta) //.............................. elsif WhiteCandle AND PriceDoji then DRAWCANDLE(Open,High,Low,Close) COLOURED(0,153,0, alfa) BORDERCOLOR(0,0,0,beta) elsif BlackCandle AND PriceDoji then DRAWCANDLE(Open,High,Low,Close) COLOURED(255,0,0, alfa) BORDERCOLOR(0,0,0,beta) elsif DojiCandle AND PriceDoji then DRAWCANDLE(Open,High,Low,Close) COLOURED(0,0,0, alfa) BORDERCOLOR(0,0,0,beta) endif // All is done RETURN |
Share this
No information on this site is investment advice or a solicitation to buy or sell any financial instrument. Past performance is not indicative of future results. Trading may expose you to risk of loss greater than your deposits and is only suitable for experienced investors who have sufficient financial means to bear such risk.
ProRealTime ITF files and other attachments :PRC is also on YouTube, subscribe to our channel for exclusive content and tutorials
