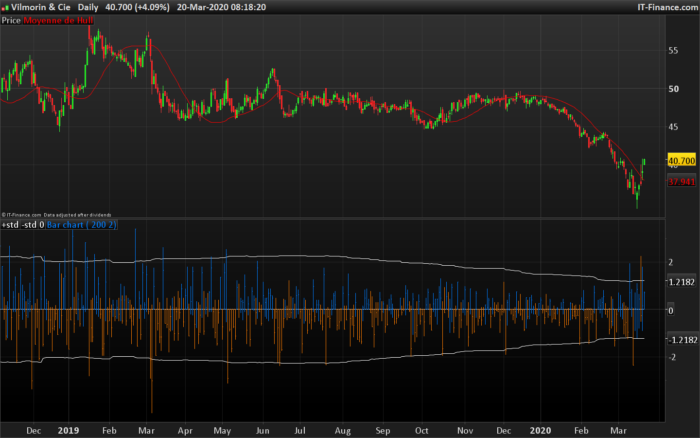
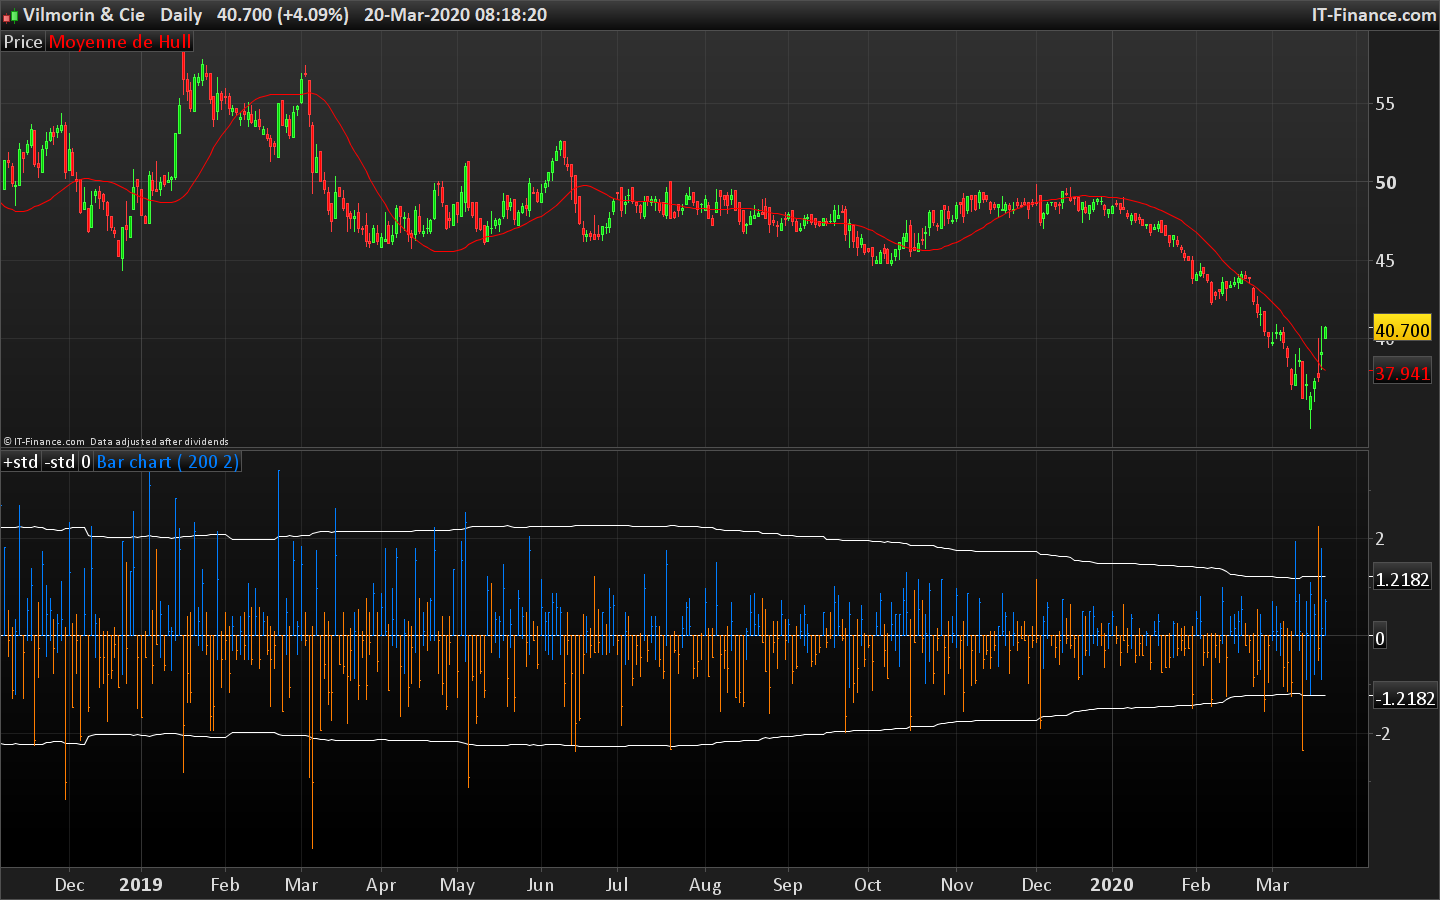
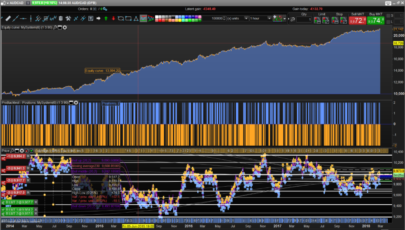
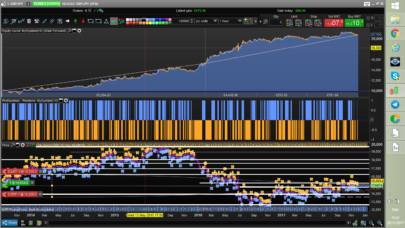
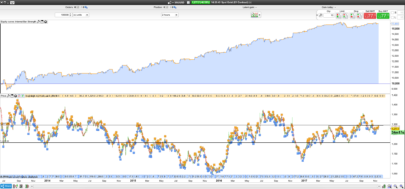
This candlestick standardization (normalized bars) indicator fixes Japanese candlesticks on a constant scale. The scale is created from the size of the candlesticks in points: Close-Open (range).
Thresholds based on standard deviations are then added, these are calculated on the basis of the last “p” candlesticks (value to be varied at will). This helps to identify abnormal candle sizes (high volatility) that can lead to a return to the mean.
|
1 2 3 4 5 6 7 8 9 10 11 12 13 14 15 16 17 18 19 20 21 22 23 24 25 26 |
// --- settings p = 900 s = 2 // --- end of settings myRange = close - open myStd = std[p](myRange)*s dynO = 0 dynH = high - open dynL = low - open dynC = close - open if dync > 0 then R = 0 G = 125 B = 255 else R = 255 G = 125 B = 0 endif DRAWBARCHART(dynO,dynH,dynL,dynC) coloured(r,g,b) return myStd as "+std", -myStd as "-std", 0 as "0" |
Share this
No information on this site is investment advice or a solicitation to buy or sell any financial instrument. Past performance is not indicative of future results. Trading may expose you to risk of loss greater than your deposits and is only suitable for experienced investors who have sufficient financial means to bear such risk.
ProRealTime ITF files and other attachments :PRC is also on YouTube, subscribe to our channel for exclusive content and tutorials



Thanks Doc !
Intresting, thank you!