Normalized Candlesticks (stochastic candles)

v10.3
Normalized Candlesticks (stochastic candles)

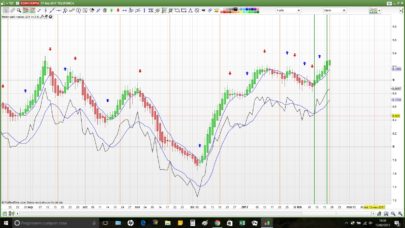
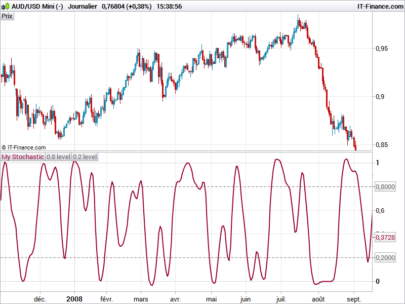
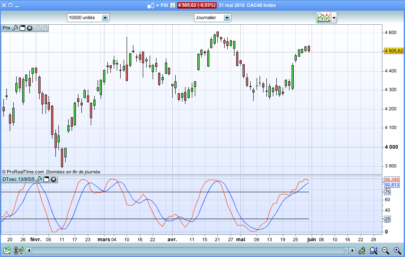
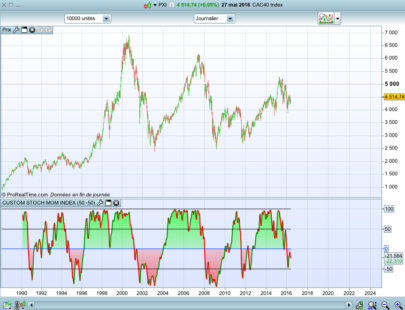
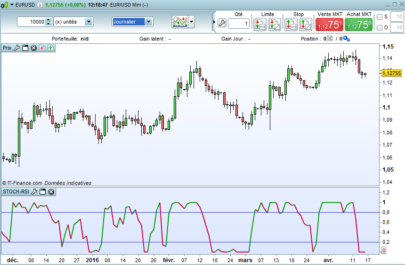
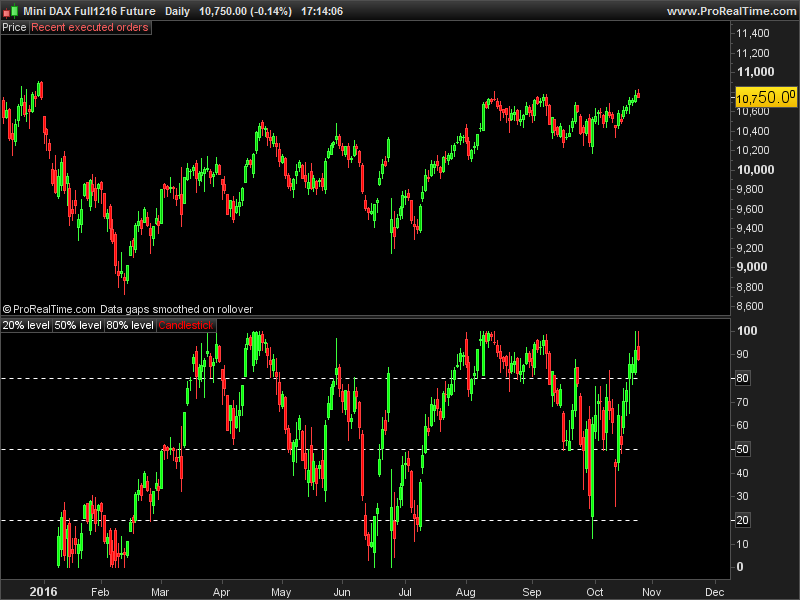
This indicator is a normalized price representation made with candlesticks. The dynamic scale between 0 and 100% is calculated upon the last X periods (50 periods in the code, you can change it at will).  It can be used to detect price exhaustion in a trend of continuation if the candlesticks remains above the 50% level.

Another utility is the use of the different levels that could be changed to Fibonacci levels for examples (23.6% 38.2% etc.) and detect rebounds of breakout of these levels.

PRT 10.3 compatible only because of the use of the DRAWCANDLE function.

Coded by request on the French forum (french video that explain the development process of the normalized candlesticks).

Share this

Risk disclosure:

No information on this site is investment advice or a solicitation to buy or sell any financial instrument. Past performance is not indicative of future results. Trading may expose you to risk of loss greater than your deposits and is only suitable for experienced investors who have sufficient financial means to bear such risk.

ProRealTime ITF files and other attachments : How to import ITF files into ProRealTime platform?

PRC is also on YouTube, subscribe to our channel for exclusive content and tutorials
  1. Madrosat • 10/25/2016 #

    Bonjour Nicolas
    Je souhaiterais faire colorier le fond du graphique supérieur en vert lorsque le close est inférieur a 20 et le
    faire colorier en rouge lorsque le close est supérieur à 80 ,j’ai essayé mais sans succès peux tu m’aider??

    • Nicolas • 10/25/2016 #

      Merci d’ouvrir un sujet dans le forum approprié.

  2. Nwab • 10/25/2016 #

    Hello Mr Nicolas..
    Please how can I set this up as an indicator to work on mt5. Your guidance is much needed. Thanks

avatar
Register or

Likes

avatar avatar avatar avatar avatar avatar avatar avatar avatar
Related users ' posts
Nicolas Restart your platform in order to be sure to use the last version, there was a version rollb...
bertrandpinoy bonjour voud pouvez m envoyer le code modifier par vous?
Nicolas Désolé , je ne comprends pas votre question.
Jessar Hi friends, is there any way to program the system to close the position when you have a lon...
Pring00 Hello @Nicolas, thanks for this code! Just what i was looking for. I'm fairly new to this...
Nicolas Needs custom coding, ask for a mod in a dedicated topic, in the appropriate forum please.
jelogui merci beaucoup Nicolas, je m'en occupe.
zeD22 Hello There Nicolas, When i try to copy the code i get an Error says: the following varia...
Nicolas Download the itf file and import it.
Nicolas Sorry but we do not provide any help for mt4 users. Our website is dedicated to ProRealTime ...
rginvest44 Bonjour Messieurs et félicitations pour votre travail. De mon coté, lorsque je souhaite e...
Nicolas Bonjour, il s'agit d'un code d'indicateur et non d'un screener. Cet autre code par exemple e...
wtangsiri Bonsoir Qu'appelez vous l'axe vertical et comment le définir ? Merci pour votre aide.
rafadonl2 Pardonnez-moi mais je ne sais pas ce que vous entendez par "axe vertical". Serait-ce la lig...
rafadonl2 Je viens de voir ce que vous voulez dire. Comme pour tout autre indicateur, vous devez défin...
gregus bonjour a tous quelqu un pourait il recodé en prt il sagit  du dynamique zone ma, je n arri...
Nicolas Merci de faire une requête spécifique sur le forum. 
Maxime Leleux Nice screener but the 2 candelsticks around the doji should be long sticks (red and green). ...
Nicolas
8 years ago
GraHal Forked code I mention above is here ... GraHal wrote: So below is the PRC Stochastic RSI v...
GraHal Try again (quite limited what you can do as Comments in the Library) https://www.prorealco...
AutoFlanders Thanks GraHal, that's what i was looking for
Nicolas Hi, there's no reason why it should not work on a 5 min chart. Just apply the indicator on y...
Percygreen77 good evening sorry for my english but the indicator don't work can you help me i have 10.3 v...
Nicolas By adding it on price, it should display the pattern detection on the price chart, and not ...
Etienne Hi, I'm quite late in this thread. I'd just like to propose an enhancement because this in...
Nicolas Thanks Etienne.
Bard Hi Nicolas, I wanted to make this scaled indicator above between -1 and +1 instead of 0 to +...
bluetime6 Hello Doctrading.   Can you ask you for something? Can you code a screener screen po...
MikeGC I don't know if you have used the variables a and b to optimise the parameters for the Super...
gianpiero75 I have not optimized, I multiplied the parameters for 6 (5,8), to use them on the 4  hoursTF...
bertrandpinoy bonjour Mike j utilise TrendChaser V2.0 et quand il prend position cela ne programme pas le ...
s00071609 Hi, could you please suggest, what this codes gives, lowest[b](rsi[a]) -- just trying to us...
Nicolas lowest[b](rsi[a]) returns the lowest values of the RSI of "a" periods, over the last "b" per...
s00071609 Hi, what would be the code to get the price for last bullish DTOSC cross over. I am looking ...
Doctrading I forgot to write at the beginning :  a = 50 b = 50 These are intermediate levels Sorry
DerPat Thank you. This one could be an aid in my current research on stochastics.
Pelayo it is possible that in line 12 we should put seuilinf=-b, thaks for all
Doctrading It works on ProRealTime CFD, but backtest begins since May 2014
alex224 Hola Andres, buen trabajo. Algun problema por usar la estrategia con acciones en time frame ...
Andres Hola Alex, no lo he probado en otros timeframes, pero con esta configuración específica no c...
Nicolas
9 years ago
lokbuscas Or in weekly??
Nicolas I don't know, you should make your own studies.
lokbuscas Ok thanks Nico
Nicolas
9 years ago
Vinks_o_7 great, thanks Nicolas !
Vinks_o_7 argh...still nothing even with 10 000 bars on daily or hourly basis...
Vinks_o_7 ok now : had to refresh the indicator.

Top