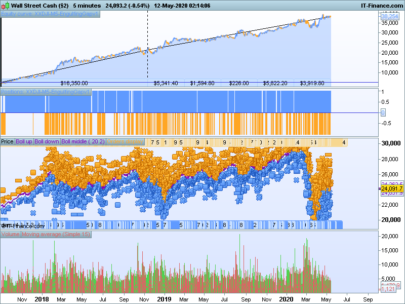
Taken from the book Bollinger on Bollinger Bands.
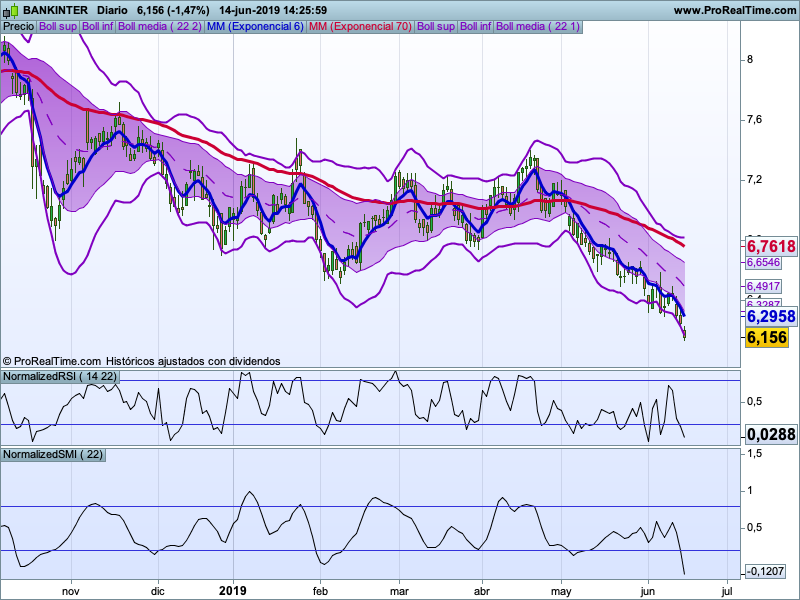
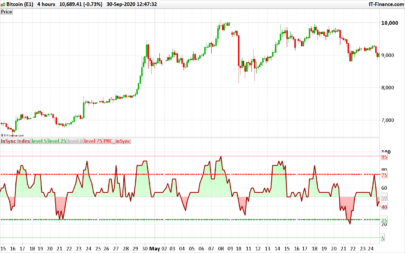
In a conversation in one of the forums, I discovered that the best way to describe this indicator is not to name it normalized, perhaps the best term is “Related to Volatility”.
The SMI is normalized according to its standard deviation around a mean calculated with an exponential moving average of 24 periods by default.
|
1 2 3 4 5 6 7 8 9 10 11 12 13 14 15 16 17 |
//********************************************************************************** //* //* Se normaliza el SMI dado un numero: Por defecto es igual que el RSI //* Autor: Rafa Barreto //* //********************************************************************************** ValorEMA=24 MiSMI = SMI[10,3,5](Close) Bollinger2UpSMI = ExponentialAverage[ValorEMA](MiSMI) + (2 * STD[ValorEMA](MiSMI)) Bollinger2DnSMI = ExponentialAverage[ValorEMA](MiSMI) - (2 * STD[ValorEMA](MiSMI)) SMINormalizado = (MiSMI - Bollinger2DnSMI) / (Bollinger2UpSMI - Bollinger2DnSMI) Return SMINormalizado |
Share this
No information on this site is investment advice or a solicitation to buy or sell any financial instrument. Past performance is not indicative of future results. Trading may expose you to risk of loss greater than your deposits and is only suitable for experienced investors who have sufficient financial means to bear such risk.
ProRealTime ITF files and other attachments :PRC is also on YouTube, subscribe to our channel for exclusive content and tutorials
