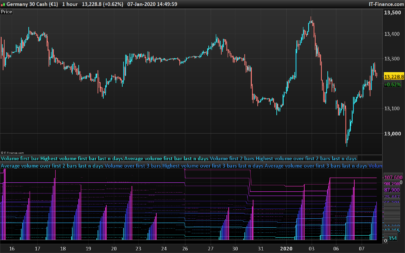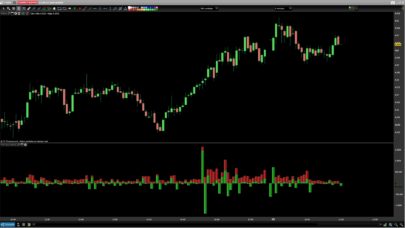
First of all, the normalized values are expressed in percentage of the average value for a period. Accordingly, the data on the chart can now take negative values, too. This will mean some lull on the market.
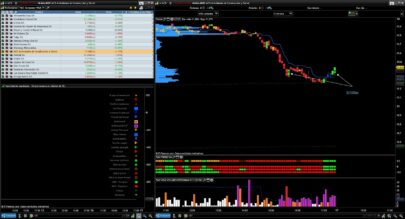
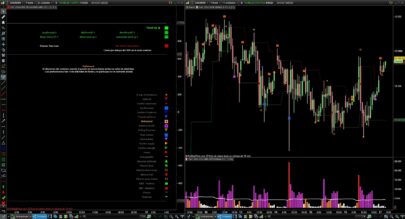
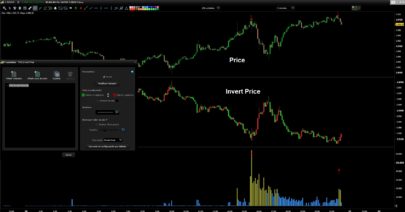
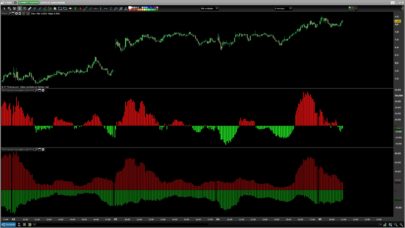
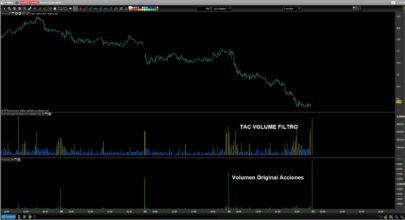
Another useful innovation is coloring histogram bars according to the normalized volume size.
– Blue color means that the current volume is less than the average one for this period.
– Dark green color means a small exceeding in volume as compared to the average one for this period.
– Light green color means that the increase in volume has exceeded the Fibo level of 38.2% as compared to the average one for this period.
– Yellow color means that the increase in volume has exceeded the Fibo level of 61.8% as compared to the average one for this period.
– White (it is red in the image below not to melt into the background) color means that the increase in volume has exceeded the Fibo level of 100% as compared to the average one for this period.
this indicator is converted from Tradingview platform and a metatrader indicator.
This volume indicator works best on comparatively small timeframes (15 minutes, for example).
See also:
– Are price updates a good proxy for actual traded volume
|
1 2 3 4 5 6 7 8 9 10 11 12 13 14 15 16 17 18 19 20 21 22 23 24 25 26 27 28 29 30 31 32 33 34 35 36 37 38 39 40 41 42 43 44 45 46 47 48 49 50 51 52 53 54 55 56 57 58 59 60 |
REM NORMALIZED VOLUME OSCILLATOR //published on the Tradingview platform by sherwind //adapted for the platform Prorealtime v 10.3 by bolsatrilera //@version=3 // // This volume indicator works best on comparatively small timeframes (15 minutes, for example). // // Based on: // - Normalized Volume Oscillator - indicator for MetaTrader 4 <https://www.mql5.com/en/code/8208> // - Using Tick Volume in Forex: A Clear NVO Based Example <http://mechanicalforex.com/2010/08/using-tick-volume-in-forex-clear.html> // // See also: // - Are price updates a good proxy for actual traded volume in FX? <https://www.fxstreet.com/education/are-price-updates-a-good-proxy-for-actual-traded-201104220000> // // // ----------------------------------------------------------------------------- // Copyright 2018 sherwind // // This program is free software: you can redistribute it and/or modify // it under the terms of the GNU General Public License as published by // the Free Software Foundation, either version 3 of the License, or // any later version. // // This program is distributed in the hope that it will be useful, // but WITHOUT ANY WARRANTY; without even the implied warranty of // MERCHANTABILITY or FITNESS FOR A PARTICULAR PURPOSE. See the // GNU General Public License for more details. // // The GNU General Public License can be found here // <http://www.gnu.org/licenses/>. inputperiod = 10 //title="Volume Period", minval=1) normalizevolume = (volume/Average[10](volume)) nvo = normalizevolume[inputperiod] * 100 - 100 if nvo < 0 then r=0 g=0 b=255 elsif nvo < 38.2 then r=0 g=128 b=0 elsif nvo < 61.8 then r=0 g=255 b=0 elsif nvo < 100 then r=255 g=165 b=0 else r=255 g=0 b=0 endif return nvo coloured(r,g,b)style(histogram)as "NVO" |
Share this
No information on this site is investment advice or a solicitation to buy or sell any financial instrument. Past performance is not indicative of future results. Trading may expose you to risk of loss greater than your deposits and is only suitable for experienced investors who have sufficient financial means to bear such risk.
ProRealTime ITF files and other attachments :
Find other exclusive trading pro-tools on ![]()
PRC is also on YouTube, subscribe to our channel for exclusive content and tutorials