Introduction
The Order-Breaker Blocks (OBB) indicator is a tool designed to identify significant areas of institutional interest on a price chart. By detecting critical zones of buying and selling pressure, it helps traders pinpoint potential reversal points and validate trend continuations. These blocks, often referred to as Order Blocks and Breaker Blocks, highlight areas where large market players, like banks or hedge funds, are likely making significant trades.
The OBB indicator aims to provide traders with an effective way to spot these areas, making it a valuable addition to any trading strategy involving price action and key support/resistance levels.
What Are Order Blocks and Breaker Blocks?
Order Blocks are areas where institutional traders have executed large orders, leaving visible footprints in the form of price consolidations or sudden price movements. These areas act as potential zones of support and resistance.
- Bullish Order Blocks: Represent buying pressure, often formed before an upward move.
- Bearish Order Blocks: Represent selling pressure, usually occurring before a downward move.
Breaker Blocks, on the other hand, signify the invalidation of a previous order block. When price breaks through an order block, it often signals a shift in market sentiment and potential trend continuation.
How the OBB Indicator Works
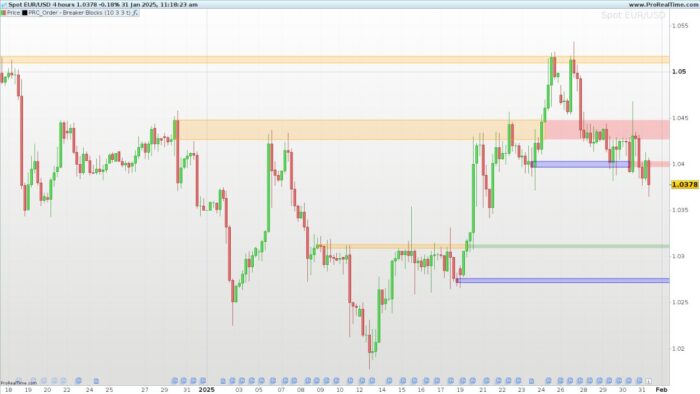
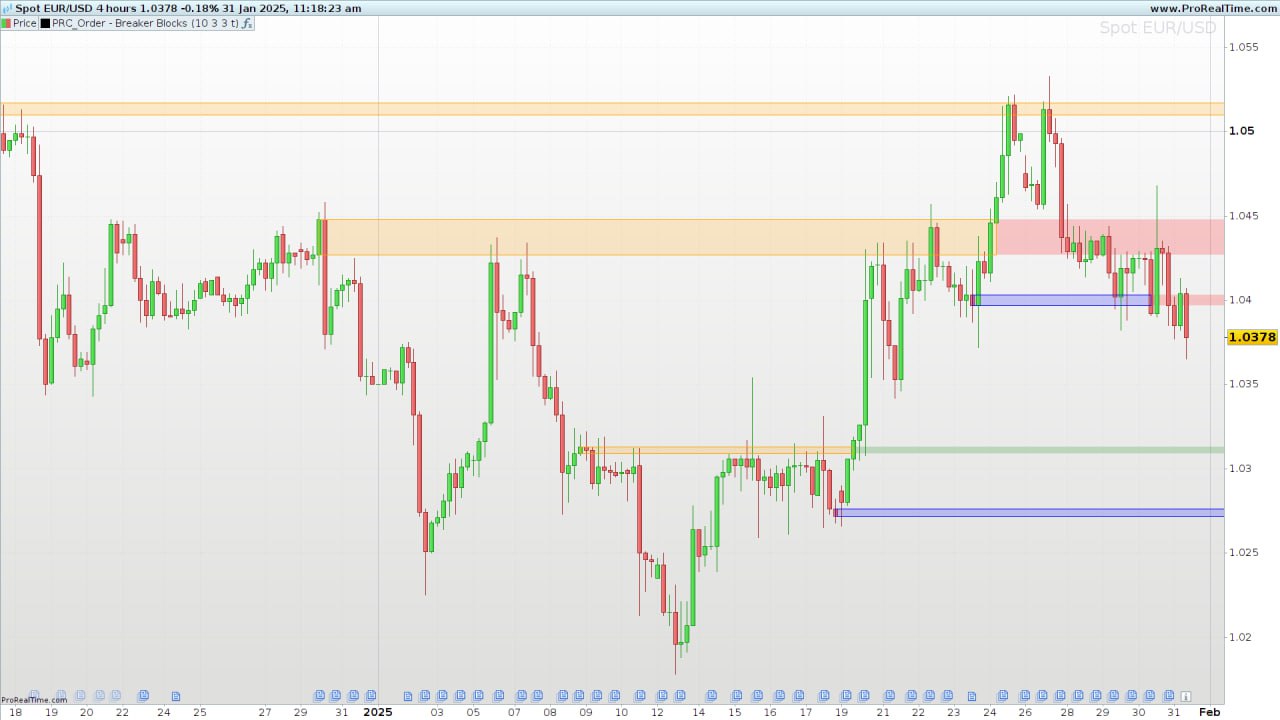
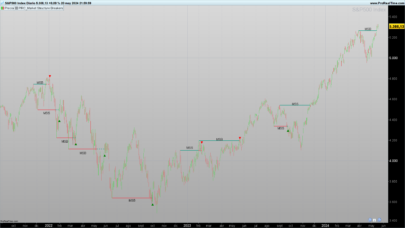
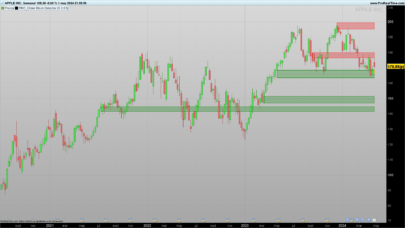
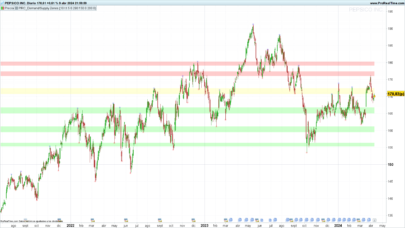
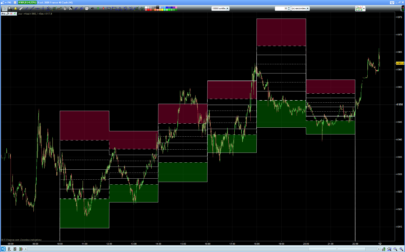
The OBB indicator automatically detects and plots bullish and bearish order blocks on the chart and monitors for breakouts through these zones. It uses a combination of swing highs and lows to define key points and validate breakouts, highlighting their status using different colors.
Key Parameters of the Indicator:
length: The lookback period to detect swing highs and lows.showBullandshowBear: Define how many bullish and bearish order blocks are displayed on the chart.useBody: A boolean setting to decide whether the blocks are calculated using the candle bodies (open/close) or wicks (high/low).
Calculation and Internal Logic
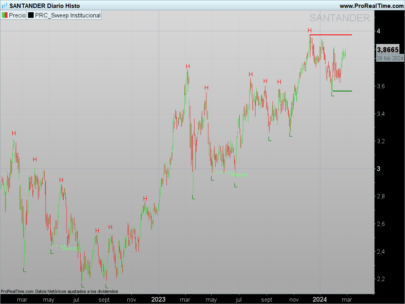
- Swing Detection:
- The indicator scans past bars (based on
length) to detect significant highs and lows, identifying swing points (topyfor highs,btmyfor lows). - Once a new swing is detected, the corresponding order block construction begins.
- The indicator scans past bars (based on
- Order Block Construction:
- For a bullish order block, the indicator identifies the highest and lowest price levels preceding the upward breakout.
- For a bearish order block, it tracks the key levels preceding the downward breakout.
- The blocks are stored as rectangles for easy visualization.
- Validation of Breakouts:
- The indicator checks whether price breaks through the upper or lower bounds of the order block.
- If the block is broken, it changes color to represent the breakout’s direction and significance.
- Graphical Representation:
- The blocks are drawn on the chart using
drawrectangle, with different colors indicating the block’s current status. - Colors include:
- Blue/orange: Active order blocks.
- Green: Bullish breakout.
- Red: Bearish breakout.
- Yellow: Uncertain state (inside the block).
- The blocks are drawn on the chart using
Indicator Customization
The OBB indicator is fully customizable, allowing traders to adapt it to various trading styles:
length: A short length (e.g., 5–10) is suitable for intraday traders, while a longer length (e.g., 20–50) may benefit swing traders.showBullandshowBear: Adjust these parameters to control how many historical order blocks are displayed.useBody: Enable this option for more conservative setups by focusing on candle bodies instead of wicks.
Trading Strategies Using the OBB Indicator
- Reversal Trades:
- Look for price rejection at a bullish or bearish order block, confirming the zone’s validity as support or resistance.
- Enter trades in the direction of the reversal with a stop loss placed just outside the block.
- Breakout Continuation:
- Use breakouts through order blocks as signals of a potential trend continuation.
- For bullish breakouts, consider long positions, and for bearish breakouts, short positions may be appropriate.
Advantages and Limitations of the OBB Indicator
Advantages:
- Identifies key zones of price action that reflect institutional interest.
- Visually clear and intuitive representation of support and resistance.
- Helps distinguish between valid and invalid breakouts.
Limitations:
- The effectiveness can be sensitive to the chosen
lengthparameter. - Requires additional validation with other indicators (e.g., volume, trend filters).
ProBuilder Code for the OBB Indicator
|
1 2 3 4 5 6 7 8 9 10 11 12 13 14 15 16 17 18 19 20 21 22 23 24 25 26 27 28 29 30 31 32 33 34 35 36 37 38 39 40 41 42 43 44 45 46 47 48 49 50 51 52 53 54 55 56 57 58 59 60 61 62 63 64 65 66 67 68 69 70 71 72 73 74 75 76 77 78 79 80 81 82 83 84 85 86 87 88 89 90 91 92 93 94 95 96 97 98 99 100 101 102 103 104 105 106 107 108 109 110 111 112 113 114 115 116 117 118 119 120 121 122 123 124 125 126 127 128 129 130 131 132 133 134 135 136 137 138 139 140 141 142 143 144 145 146 147 148 149 150 151 152 153 154 155 156 157 158 159 160 161 162 163 164 165 |
//---------------------------------------------------------// //PRC_Order Blocks and Breaker Blocks //version = 0 //30.09.2024 //Iván González @ www.prorealcode.com //Sharing ProRealTime knowledge //---------------------------------------------------------// //-----Inputs----------------------------------------------// //---------------------------------------------------------// length=10 //Swing Lookback showBull=5 //Show last bullish OB showBear=5 //Show last bearish OB useBody=0 //---------------------------------------------------------// //-----Detect Swings---------------------------------------// //---------------------------------------------------------// n=barindex once os=0 upper=highest[length](high) lower=lowest[length](low) if high[length]>upper then os=0 elsif low[length]<lower then os=1 else os=os endif if os=0 and os[1]<>0 then topy=high[length] topx=barindex[length] topcrossed=0 elsif os=1 and os[1]<>1 then btmy=low[length] btmx=barindex[length] btmcrossed=0 endif if usebody then mimax=max(close,open) mimin=min(close,open) else mimax=high mimin=low endif //---------------------------------------------------------// //-----Bullish OB------------------------------------------// //---------------------------------------------------------// if close > topy and topcrossed=0 then topcrossed=1 minima=mimax[1] maxima=mimin[1] loc=barindex[1] for i=1 to (n-topx)-1 do minima=min(mimin[i],minima) if minima=mimin[i] then maxima=mimax[i] loc=barindex[i] else maxima=maxima loc=loc endif next $bullTop[m+1]=maxima $bullBtm[m+1]=minima $bullx[m+1]=loc $bullbreak[m+1]=0 m=m+1 endif //---------------------------------------------------------// //-----Bearish OB------------------------------------------// //---------------------------------------------------------// bearBreakConf=0 if close < btmy and btmcrossed=0 then btmcrossed=1 minima2=mimin[1] maxima2=mimax[1] loc2=barindex[1] for i=1 to (n-btmx)-1 do maxima2=max(mimax[i],maxima2) if maxima2=mimax[i] then minima2=mimin[i] loc2=barindex[i] else minima2=minima2 loc2=loc2 endif next $bearTop[z+1]=maxima2 $bearBtm[z+1]=minima2 $bearx[z+1]=loc2 $bearbreak[z+1]=0 z=z+1 endif //---------------------------------------------------------// //-----Plot Order Blocks-----------------------------------// //---------------------------------------------------------// if islastbarupdate then for i=m downto 1 do for j=barindex downto 0 do if barindex[j]>$bullx[i] and close[j] < $bullBtm[i] then $bullright[i]=barindex[j] $bullbreak[i]=1 break else $bullright[i]=barindex endif next if i>m-showbull then if $bullbreak[i]=0 then drawrectangle($bullx[i],$bullBtm[i],$bullright[i]+20,$bullTop[i])coloured("blue")fillcolor("blue",50) elsif $bullbreak[i]=1 then drawrectangle($bullx[i],$bullBtm[i],$bullright[i],$bullTop[i])coloured("blue")fillcolor("blue",50) if close>$bullTop[i]then drawrectangle($bullright[i],$bullBtm[i],barindex+20,$bullTop[i])coloured("green",0)fillcolor("green",50) elsif close<$bullBtm[i]then drawrectangle($bullright[i],$bullBtm[i],barindex+20,$bullTop[i])coloured("red",0)fillcolor("red",50) else drawrectangle($bullright[i],$bullBtm[i],barindex+20,$bullTop[i])coloured("yellow",0)fillcolor("yellow",50) endif endif endif next for i=z downto 1 do for j=barindex downto 0 do if barindex[j]>$bearx[i] and close[j] > $bearTop[i] then $bearright[i]=barindex[j] $bearbreak[i]=1 break else $bearright[i]=barindex endif next if i>z-showbear then if $bearbreak[i]=0 then drawrectangle($bearx[i],$bearBtm[i],$bearright[i]+20,$bearTop[i])coloured("orange")fillcolor("orange",50) elsif $bearbreak[i]=1 then drawrectangle($bearx[i],$bearBtm[i],$bearright[i],$bearTop[i])coloured("orange")fillcolor("orange",50) if close>$bearTop[i]then drawrectangle($bearright[i],$bearBtm[i],barindex+20,$bearTop[i])coloured("green",0)fillcolor("green",50) elsif close<$bearBtm[i]then drawrectangle($bearright[i],$bearBtm[i],barindex+20,$bearTop[i])coloured("red",0)fillcolor("red",50) else drawrectangle($bearright[i],$bearBtm[i],barindex+20,$bearTop[i])coloured("yellow",0)fillcolor("yellow",50) endif endif endif next endif return |
Conclusion
The Order-Breaker Blocks (OBB) indicator provides traders with a systematic approach to identifying and validating key zones of institutional buying and selling. By combining order blocks and breaker blocks with customizable parameters, traders can better interpret market movements and optimize their trading strategies. As always, it is recommended to test the indicator in simulated environments before applying it in live trading.
Share this
No information on this site is investment advice or a solicitation to buy or sell any financial instrument. Past performance is not indicative of future results. Trading may expose you to risk of loss greater than your deposits and is only suitable for experienced investors who have sufficient financial means to bear such risk.
ProRealTime ITF files and other attachments :
Find other exclusive trading pro-tools on ![]()
PRC is also on YouTube, subscribe to our channel for exclusive content and tutorials


Ciao Ivan, mi dice errore interno linea 1, ordine sconosciuto. Come posso risolvere?
Ciao, forse è perché hai la versione V11 e non la V12?
Se è così, nelle righe in cui ti viene chiesto di disegnare un rettangolo rimuovi la parte che dice “fillcolor(”colore“)”.
I tuoi indicatori sono sempre molto interessanti, al riguardo ti chiedo chiarimenti: I colori delle barre sono misti e non singoli come da te descritti, inoltre lo trovo simile al PRC INVERSION FAIR VALUE CAP , mi puoi indicare le differenze?
Salve, grazie.
I colori cambiano a seconda della posizione del prezzo e se ha superato il livello contrassegnato.
La differenza con l’indicatore precedente è il calcolo del “order block”. Non ha nulla a che fare…
Ciao Ivan, sia su questo indicatore che su quello precedente mi dice come errore “ciclo infinito o troppe interazioni” come posso risolvere, grazie
È possibile che siano state caricate troppe barre nel grafico.
Hola Iván, en primer lugar agradecerte el trabajo que haces, y comentarte algo sobre este indicador, nos es muy parecido al que publicaste hace 6 meses SMC, (dinero inteligente)?, si te tuvieras que quedar con uno de los dos?, y hay alguna posibilidad de poder usar en él proScreener alcista y bajista?, gracias
ok fatto avevi ragione, grazie