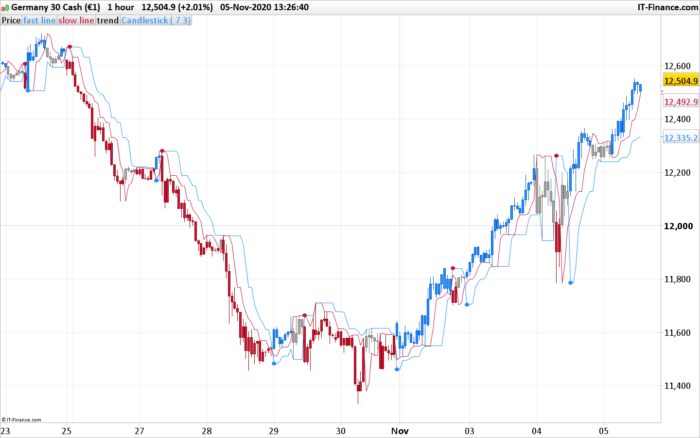
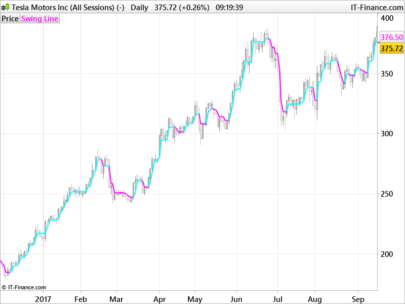
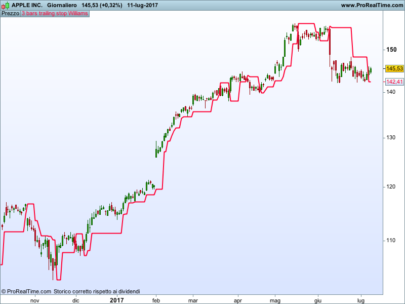
This is a variation of a well known perfect trend line indicator (the initial version can be found here: Perfect Trend Line
This version is adding a sort of signals filtering which helps in cleaning up some false signals that are there in the original version.
Usage :
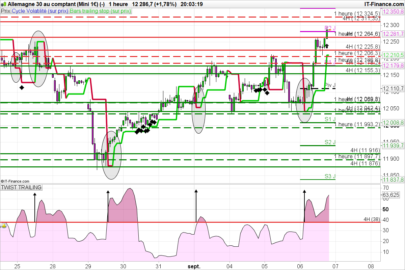
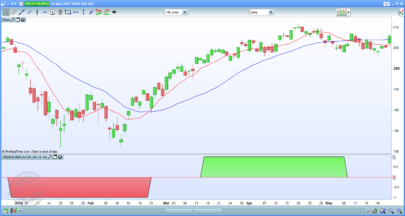
- You can use the arrows (dots) as early signals
- You can use the appearance of the color candle as signal for entry or re-entry
|
1 2 3 4 5 6 7 8 9 10 11 12 13 14 15 16 17 18 19 20 21 22 23 24 25 26 27 28 29 30 31 32 33 34 35 36 37 38 39 40 41 42 43 44 45 46 47 48 49 50 51 52 53 54 55 56 57 58 59 60 61 62 63 64 65 66 67 68 69 70 71 72 73 74 75 76 77 78 79 80 81 82 |
//PRC_PerfectTrendLine 2 | indicator //05.11.2020 //Nicolas @ www.prorealcode.com //Sharing ProRealTime knowledge //converted from MT5 version (original author mladen) //enhanced version by Nicolas // --- settings SlowLength = 7 // Slow length FastLength = 3 // Fast length // --- end of settings fasthigh = Highest[SlowLength](high)//[1] fastlow = Lowest[SlowLength](low)//[1] slowhigh = Highest[FastLength](high)//[1] slowlow = Lowest[FastLength](low)//[1] if high<slowhigh then thighs=slowhigh else thighs=high endif if low>slowlow then tlows=slowlow else tlows=low endif if high<fasthigh then thighf=fasthigh else thighf=high endif if low>fastlow then tlowf=fastlow else tlowf=low endif if close>slowln[1] then slowln=tlows else slowln=thighs endif if close>fastln[1] then fastln=tlowf else fastln=thighf endif once trend=-1 if close<slowln and close<fastln then trend=1 endif if close>slowln and close>fastln then trend=0 endif if trend<>trend[1] then if trend=0 then r=30 g=144 b=255 else r=200 g=20 b=60 endif drawtext("●",barindex,fastln,Dialog,Bold,10) coloured(r,g,b) endif drawcandle(open,high,low,close) coloured(168,168,168) if trend=0 then if close>slowln then drawcandle(open,high,low,close) coloured(30,144,255) endif elsif trend=1 then if close<slowln then drawcandle(open,high,low,close) coloured(200,20,60) endif endif return fastln coloured(30,144,255) as "fast line",slowln coloured(200,20,60) as "slow line", trend as "trend" |
Share this
No information on this site is investment advice or a solicitation to buy or sell any financial instrument. Past performance is not indicative of future results. Trading may expose you to risk of loss greater than your deposits and is only suitable for experienced investors who have sufficient financial means to bear such risk.
ProRealTime ITF files and other attachments :
Find other exclusive trading pro-tools on ![]()
PRC is also on YouTube, subscribe to our channel for exclusive content and tutorials


HI NICOLAS, HOW CAN I CONNECT WOTH YOU, BECAUSE I NEED HELP WITH A NEW SIGNAL TO PROGRAMATE FOR A PRO REAL TIME TKS
For private paid assistance you can contact me on this page: https://www.prorealcode.com/trading-programming-services/
For any other coding query, you can use our free public forums.
I have v10.3 via IG and usually, all your indicators display correctly but this one is just very squashed in a narrow horizontal line, dots, candlesticks, and all. Adjusting the optimised scale button and Zoom in/out buttons does little to affect it. Any suggestions to cure that? Thank you.
in the price settings window, check the box for “Vertical autoscaling: use price only”. Or remove , trend as “trend” in the last line of the code.
That did it! Nicolas, what a modest genius you are! Thank you for your work and all you offer on this site.
Bonjour Nicolas,
est ce que ton indicateur est utilisable sur toutes les UT ? Et sur la dernière version de PRT ?
Merci
Oui, il peut être appliqué sur toutes les unités de temps et fonctionne sur prorealtime v11.
merci pour ce retour et je tiens a vous remercier sur la qualité de vos indicateurs.
Cependant, pourquoi quand je le combine avec votre indicateur “Top Bottom indicator” j’observe un décalage et je ne suis pas sur les même tops entre les 2 indicateurs ?
bonjour nicolas,
cet indicaeur marche une seule fois lors du chargement la premiere fois dans le graphes , si par exemple il es chargé en 15 min , si je passe à l’UT 5 min , il devient plat , et n’est plus visible
Ajoutez: “if barindex>slowlength” à la ligne 17, sans les guillemets
et “endif” à la ligne 80.
idem, même problème, bizarre ^^
j’ai ajouté la condition , j’ai toujours le meme probléme , j’ai pourtant ,prt v11 !
maintenant il ne s’affiche plus du tout dans n’importer quelle UT
Aucun problème de mon côté, quel instrument en particulier? Combien de données affichées sur le graphique? (unités / barres / chandeliers).
micro gold future/micro s&p/micro DJ sur UT 1h-15′-5′ ,j’utilise un affichage 200 unité – avec des bougies style (Hollow candle)
Aucun problème pour ma part avec les settings par défaut.
étrange ! en tout cas merci , rien qu’en l’employant seul il donne de bons résultats. surtout avec la nouvelle fonction de filtre
Hi Nicolas, firstly… amazing indicator THANK YOU! Question, is there anyway to change the red and blue dots to larger arrows? Would you be able to post the code to change this? Thanks in advance. Nick.
bigger dots, replace 10 by a value like 25, at line 68.
Legend! Much appreciated Thank You…
Bonjour Nicolas
je suis débutant en trading
1) les bougies grises, c’est quoi la signification ?stp
2) pour fermer ma position , je dois toujours travailler avec support et résistance ( comment tu f pour savoir a quelle moment tu coupe ton Trade: stop loss??)
Merci
Un grand Merci pour ce travail !
bonjour
que représente les bougies grises
ce sont les bougies situées dessous/dessus la ligne rouge, selon le sens de la tendance (pullback).
Merci Nicolas pour cet indicateur, j’ai rencontré le même souci de graph qui s’aplatissait après le changement d’UT, j’ai résolu le souci en rendant invisible la ‘trend’ dans l’indicateur, je vais maintenant pouvoir tester tout ca, encore un grand merci Amicalement Laurent
Nicolas, existe-t-il un screnner pour detecter automatiquement les signaux d’achat ou possible de travailler sur cet indicateur pour le transformer ?
merci
Faire un CALL et utiliser la dernière variable “trend” comme signal, la condition serait du type: condition=trendtrend[1]
Et ca donne quoi concretement ? 🙂
Merci Nicolas pour le code, je l’ai retravaillé et j’ai optimisé le code pour le même résultat y’a toute une partie ou tu calcules les plus haut et les plus bas qui est redondée, c’est fait automatiquement par PRT dans ton init des variables :
// ===================TrendLine Indicateur====================
// Variables du Trend
SlowLength = 7 // Slow length
FastLength = 3 // Fast length
// Calcul des plus Haut et des plus bas sur les 2 périodes
fasthigh = Highest[FastLength](high)
fastlow = Lowest[FastLength](low)
slowhigh = Highest[SlowLength](high)
slowlow = Lowest[SlowLength](low)
if close > fastln[1] then
fastln=fastlow
else
fastln=fasthigh
endif
if close > slowln[1] then
slowln=slowlow
else
slowln=slowhigh
endif
once trend=-1
if close < fastln and close fastln and close > slowln then
trend=0
endif
if trendtrend[1] then
if trend=0 then
r=30
g=144
b=255
else
r=200
g=20
b=60
endif
drawtext(“●”,barindex,slowln,Dialog,Bold,10) coloured(r,g,b)
endif
drawcandle(open,high,low,close) coloured(168,168,168)
if trend=0 then
if close>fastln then
drawcandle(open,high,low,close) coloured(30,144,255)
endif
elsif trend=1 then
if close<fastln then
drawcandle(open,high,low,close) coloured(200,20,60)
endif
endif
return fastln coloured(200,20,60) as "fast line", slowln coloured(30,144,255) as "slow line", trend as "trend"
Hi, someone could explain how the program knows what is the term: “slowln” (in line 39), because the term is not defined (in line 18, for example, the expression “slowhigh” instead is clear because refer to: Highest[FastLength](high) .
Thanks
To be more precise, what I don’t understand is how it is possible that the variables: “slowln” and “fastln” have never been assigned. Thanks
these variables are assigned between lines 39 to 48
Hi Nicolas, could you recommend me some mid-high level programming manuals for Prt or similar language ? (english-french-italian-german) Thanks
Bonjour Nicolas,
Un grand merci pour cet Indicateur, et de partager tout ce travail.
J’ai pu affiner mes entrées et sorties de positions avec une meilleure précision.
Bravo
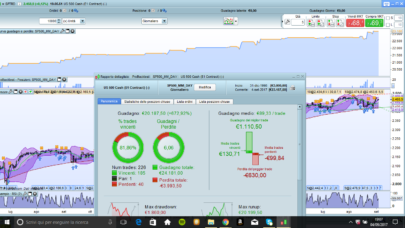
Have you please a backtest for this indicator “perfecttrenline-2”
Bonjour Nicolas,
si je souhaite avoir un screener me signalant que les actions ayant un point bleu, quel pourrait etre celui-ci ?
Détecter un croisement entre les lignes bleu et rouge, soit les 2 variables retournées par l’indicateur. Facile avec la création assistée.
J’ai creer un screnner avec la easy programmation avec FL = SL le tout avec periode en cours mais le screenner me sort que des anciens !?
J’ai bien tente de creer le screnner
indicator1, ignored, ignored, ignored = CALL “PRC_PerfectTrendLine 2″[7, 3]
ignored, indicator2, ignored, ignored = CALL “PRC_PerfectTrendLine 2″[7, 3]
c1 = (indicator1 CROSSES UNDER indicator2)
SCREENER[c1] ((close/DClose(1)-1)*100 AS “% Veille”)
mais j’ai un message d’erreur “retoune 3 valeurs mais le code en a besoon de4 ”
Un coup de main 🙂
This is one of the best indicator ever made
Congrats!
Bonjour Nicolas,
je m’intéresse de plus en plus à ton indicateur car les signaux d’entrée tiennent la route et j’ai réussi en le passer en screnner 🙂
Le pb est que je l’utilise sur les périodes journalier et hebdo mais impossible de l’uliser en mensuel car PRT ne propose pas cet UT.
Quel serait la solution car l’idée serait de screnner sur ces trois périodes et d’ensuite compiler sur excel et trouver toutes les actions qui ont le point bleu en mensuel, hebdo, journalier.
Merci pou ton aide précieuse
multiplier les périodes ? Il y a 4 semaines dans 1 mois, donc dans le TF hebdo, screener avec la période * 4.
Le pb est que je screen en journalier et hebdo directement dans la sélection mais pour screener en mensuel, à quel endroit faut-il que j’ajoute le *4 ? Voici mon prog
// — settings
SlowLength = 7 // Slow length
SlowPipDisplace = 0 // Slow pip displace
FastLength = 3 // Fast length
FastPipDisplace = 0 // Fast pip displace
c1 = volume
// — end of settings
thigh1 = Highest[SlowLength](high)+ SlowPipDisplace*pointsize
tlow1 = Lowest[SlowLength](low)- SlowPipDisplace*pointsize
thigh2 = Highest[FastLength](high)+ FastPipDisplace*pointsize
tlow2 = Lowest[FastLength](low)- FastPipDisplace*pointsize
if barindex>2 then
if Close >line1[1] then
line1 = tlow1
else
line1 = thigh1
endif
if Close>line2[1] then
line2 = tlow2
else
line2 = thigh2
endif
endif
if (Close[0]<line1[0] and Close[0]line1[0] and Close[0]>line2[0]) then
trend = -1
endif
if (line1[0]>line2[0] or trend[0] = 1) then
trena = 1
endif
if (line1[0]5000]
il s’agit des périodes de calcul SlowLength et FastLength (7*4 et 3*4)
merci Nicolas
En revanche je ne comprends pas : en période hebdo et en appliquant le *4 avec Actions France, il me sort les actions AF, AC, VK, CDA, GECP mais en naviguant sur d’autres actions je tombe sur ALHYG et FP avec point bleu alors que mon screener ne les a pas détecter !?
// — settings
SlowLength = 7*4 // Slow length
SlowPipDisplace = 0 // Slow pip displace
FastLength = 3*4 // Fast length
FastPipDisplace = 0 // Fast pip displace
c1 = volume
// — end of settings
thigh1 = Highest[SlowLength](high)+ SlowPipDisplace*pointsize
tlow1 = Lowest[SlowLength](low)- SlowPipDisplace*pointsize
thigh2 = Highest[FastLength](high)+ FastPipDisplace*pointsize
tlow2 = Lowest[FastLength](low)- FastPipDisplace*pointsize
if barindex>2 then
if Close >line1[1] then
line1 = tlow1
else
line1 = thigh1
endif
if Close>line2[1] then
line2 = tlow2
else
line2 = thigh2
endif
endif
if (Close[0]<line1[0] and Close[0]line1[0] and Close[0]>line2[0]) then
trend = -1
endif
if (line1[0]>line2[0] or trend[0] = 1) then
trena = 1
endif
if (line1[0]5000]
c’est plus une méthode de contournement que l’utilisation réelle du timeframe monthly.
Mais est-il possible de programmer en TF monthly alors que PRT propose max weekly ?
c’est très complexe dans ProScreener et différent pour chaque code, peut être dans sa prochaine version quand il intégrera les variables en tableaux.
Bonjour Manu L, merci pur le code de ton screener. pour ma part j’ai 2 erreurs qui ressortent
1ere erreur sur la ligne:
if (Close[0]line2[0]) then
il manque un paramètre entre Close[0]line1[0]
2eme erreur :
dernier ligne
if (line1[0]5000], ici il manque pas du code pour la fin du screener ? peux tu m’indiquer quelles sont les erreurs a corriger ou bien reposter on code complet, ça serait otp . merci toi.
// — settings
SlowLength = 7*4 // Slow length
SlowPipDisplace = 0 // Slow pip displace
FastLength = 3*4 // Fast length
FastPipDisplace = 0 // Fast pip displace
c1 = volume
// — end of settings
thigh1 = Highest[SlowLength](high)+ SlowPipDisplace*pointsize
tlow1 = Lowest[SlowLength](low)- SlowPipDisplace*pointsize
thigh2 = Highest[FastLength](high)+ FastPipDisplace*pointsize
tlow2 = Lowest[FastLength](low)- FastPipDisplace*pointsize
if barindex>2 then
if Close >line1[1] then
line1 = tlow1
else
line1 = thigh1
endif
if Close>line2[1] then
line2 = tlow2
else
line2 = thigh2
endif
endif
if (Close[0]<line1[0] and Close[0]<line2[0]) then
trend = 1
endif
if (Close[0]>line1[0] and Close[0]>line2[0]) then
trend = -1
endif
if (line1[0]>line2[0] or trend[0] = 1) then
trena = 1
endif
if (line1[0]<line2[0] or trend[0] = -1) then
trena = -1
endif
screener[trena=-1 and trena[1]=1 and c1>5000]
Hi Nicolas,
I am new here, what language is the above code in, I want to try implementation in python?
Thanks
Bonjour Nicolas,
je te contacte car j’avais un indicateur PRC_FractalsTrendLine.itf mais celui beug et impossible de retrouver le lien du post pour récupérer la source.
J’ai bien les diagonales qui s’affichent mais plus les paliers de S/R. serais-tu me retrouver celui-ci.
En te remerciant
C’est dans ce sujet: https://www.prorealcode.com/topic/trendline-une-approche-du-trading/
Merci de poser la question dans celui-ci.
defparam drawonlastbaronly = true
//fractals
cp = lookback
if high[cp] >= highest[(cp)*2+1](high) then
LLH = 1
else
LLH = 0
endif
if low[cp] <= lowest[(cp)*2+1](low) then
LLL = -1
else
LLL = 0
endif
if LLH = 1 then
oldLTOPy = LTOPy[1]
oldLTOPx = LTOPx[1]
LTOPy = high[cp]
LTOPx = barindex[cp]
endif
if LLL = -1 then
oldLBOTy = LBOTy[1]
oldLBOTx = LBOTx[1]
LBOTy = low[cp]
LBOTx = barindex[cp]
endif
//trend line
DRAWLINE(oldLTOPx,oldLTOPy,LTOPx,LTOPy)coloured(112,169,161)
DRAWLINE(oldLBOTx,oldLBOTy,LBOTx,LBOTy)coloured(211,78,36)
//support/resistance
if showSR then
DRAWHLINE(LTOPy) COLOURED(207,215,199,100)
DRAWHLINE(LBOTy) COLOURED(207,215,199,100)
endif
RETURN
C’est cette partie qui ne s’affiche plus
//support/resistance
if showSR then
DRAWHLINE(LTOPy) COLOURED(207,215,199,100)
DRAWHLINE(LBOTy) COLOURED(207,215,199,100)
endif
Bonjour Nicolas,
comment est-il possible de backtester cet indicateur?
cela fait une erreur “retourne 3 valeurs mais votre code en a besoin de 4” désolé cela fait plus de 5 ans que je n’ai pas programmé sur PRT…je vais profiter des vacances pour m’y remettre
D’avance merci pour votre réponse
Et merci et bravo pour la qualité des indicateurs que vous postez !
Oui bien sûr, il doit y avoir pas mal de sujets dans le forum à ce propos.
Bonjour, merci beaucoup pour cet indicateur je le trouve très clair et pertinent.