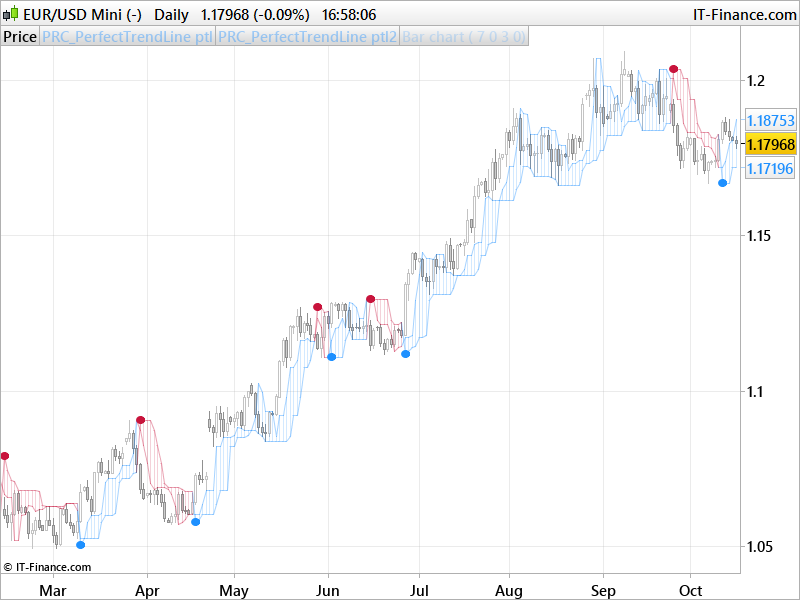
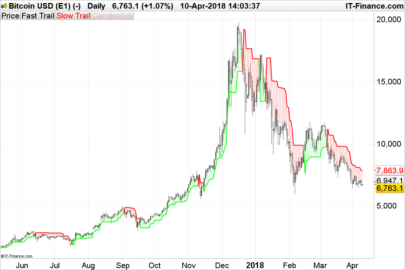
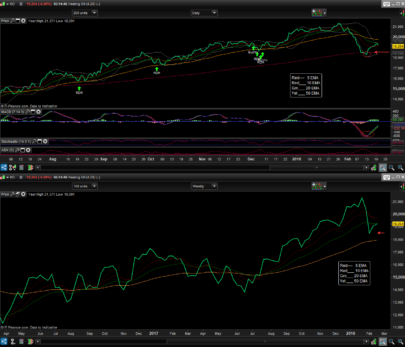
The Perfect Trend Line indicator act as a trend following indicator. It is simply made of 2 lines from highest high and lowest low of 2 different periods, one short and a longer one.
If the price breaches the longest line, it is a sign a of potential trend reversal, while if price is in the cloud made of these 2 lines, it is only a retracement and a potential price rebound in the same direction as the main trend.
Confirmation of trend reversal are highlighted with blue and red dots.
The cloud can be expanded with the SlowPipDisplace and the FastPipDisplace settings which must be set in points/pips values.
|
1 2 3 4 5 6 7 8 9 10 11 12 13 14 15 16 17 18 19 20 21 22 23 24 25 26 27 28 29 30 31 32 33 34 35 36 37 38 39 40 41 42 43 44 45 46 47 48 49 50 51 52 53 54 55 56 57 58 59 60 61 |
//PRC_PerfectTrendLine ptl | indicator //16.10.2017 //Nicolas @ www.prorealcode.com //Sharing ProRealTime knowledge //converted from MT4 version (original author mladen) //enhanced version by Nicolas // --- settings //SlowLength = 7 // Slow length //SlowPipDisplace = 0 // Slow pip displace //FastLength = 3 // Fast length //FastPipDisplace = 0 // Fast pip displace // --- end of settings thigh1 = Highest[SlowLength](high)+ SlowPipDisplace*pointsize tlow1 = Lowest[SlowLength](low)- SlowPipDisplace*pointsize thigh2 = Highest[FastLength](high)+ FastPipDisplace*pointsize tlow2 = Lowest[FastLength](low)- FastPipDisplace*pointsize if barindex>2 then if Close>line1[1] then line1 = tlow1 else line1 = thigh1 endif if Close>line2[1] then line2 = tlow2 else line2 = thigh2 endif endif if (Close[0]<line1[0] and Close[0]<line2[0]) then trend = 1 endif if (Close[0]>line1[0] and Close[0]>line2[0]) then trend = -1 endif if (line1[0]>line2[0] or trend[0] = 1) then trena = 1 endif if (line1[0]<line2[0] or trend[0] = -1) then trena = -1 endif if trena<>trena[1] then if trena=1 then x = max(line1,line2) r=200 g=20 b=60 else x = min(line1,line2) r=30 g=144 b=255 endif drawtext("●",barindex,x,Dialog,Bold,10) coloured(r,g,b) endif drawbarchart(line1,line2,line1,line2) coloured(r,g,b,50) return line1 coloured(r,g,b,100) style(line,1),line2 coloured(r,g,b,100) style(line,1) |
Share this
No information on this site is investment advice or a solicitation to buy or sell any financial instrument. Past performance is not indicative of future results. Trading may expose you to risk of loss greater than your deposits and is only suitable for experienced investors who have sufficient financial means to bear such risk.
ProRealTime ITF files and other attachments :
Find other exclusive trading pro-tools on ![]()
PRC is also on YouTube, subscribe to our channel for exclusive content and tutorials


Merci !
Bonjour,
Cet indicateur ne semble fonctionner qu’avec le forex. Est-ce qu’il serait possible d’avoir la même chose pour les actions ?
L’indicateur est bien compatible avec tous les instruments. Merci de préciser ce qui ne semble pas fonctionner ?
Voici ce que me retourne le logiciel :
Erreur de syntaxe :
Veuillez définir la variable suivante : slowlenght
Veuillez définir la variable suivante : slowpipdisplace
Veuillez définir la variable suivante : fastlenght
Veuillez définir la variable suivante : fastpipdisplace
je vois tu as copié/collé le code plutôt que l’avoir téléchargé, veuillez soit le télécharger et le réimporter dans la plateforme, soit décommenter les lignes 9 à 12 (enlever les //).
Merci Nicolas. Effectivement, c’était bien le problème. Est-ce que ces variables lignes 9 à 12 sont optimisées pour du journalier Actions Euronext ? Sinon, quelles valeurs sont idéales ?
Il n’y a pas de valeurs optimales, il s’agit de derniers plus haut et derniers plus bas sur les X dernières bougies.
OK merci !
Hello Nicolas
to use this in a automated strategy let say on a daily chart how can we perform that i tried this for Buy but dosent work
a1 = myPRCPerfectTrendLineptl2 > Dclose(1)
a2 = myPRCPerfectTrendLineptl2 myPRCPerfectTrendLineptl
Nicolas, ho realizzato uno screener dall’indicatore perfect trend-line. Lo screener mi restituisce tutte le azioni di un paniere, mentre io vorrei solo trovare quelle in situazione di “●” cambio trend da long a short o viceversa. Mi puoi aiutare? Grazie
//PRC_PerfectTrendLine ptl | screener
//16.10.2017
//Nicolas @ http://www.prorealcode.com
//Sharing ProRealTime knowledge
//converted from MT4 version (original author mladen)
//enhanced version by Nicolas
// — settings
SlowLength = 7 // Slow length
SlowPipDisplace = 0 // Slow pip displace
FastLength = 3 // Fast length
FastPipDisplace = 0 // Fast pip displace
// — end of settings
thigh1 = Highest[SlowLength](high)+ SlowPipDisplace*pointsize
tlow1 = Lowest[SlowLength](low)- SlowPipDisplace*pointsize
thigh2 = Highest[FastLength](high)+ FastPipDisplace*pointsize
tlow2 = Lowest[FastLength](low)- FastPipDisplace*pointsize
if barindex>2 then
if Close>line1[1] then
line1 = tlow1
else
line1 = thigh1
endif
if Close>line2[1] then
line2 = tlow2
else
line2 = thigh2
endif
endif
if (Close[0]<line1[0] and Close[0]line1[0] and Close[0]>line2[0]) then
trend = -1
endif
if (line1[0]>line2[0] or trend[0] = 1) then
trena = 1
endif
if (line1[0]<line2[0] or trend[0] = -1) then
trena = -1
endif
if trenatrena[1] then
if trena=1 then
x = max(line1,line2)
else
x = min(line1,line2)
endif
endif
SCREENER (x)
Can you please use English?
Voilà:
Nicolas, I realized a screener with the perfect trend-line indicator. The screener returns all the shares into a basket, while I just want to find those in a “●” trend setting from long to short or vice versa. Can you help me? Thank you
Hello Nicolas, first of all thank you for your amazing work, I downloaded the perfect trend indicator. I work only with the Dax full future in 1 minute. I’m looking for 10 points daily and I have tested your indicator for a week. I have a problem that I could’t resolve yet, when the blue/red dot gets on and I put an order based in that and then it gets off and doesn’t makes the reversal move. So, when can I be “sure” of the reversal, and the other question is if this indicator is the best to work with the Dax in 1 minute. Thank you.
Like any other indicators, you must wait for a close to validate a signal (blue and red dots). This one is not better than any other, like I said already, it only generates signals depending of breakout of recent highest high and lowest low, sometimes it works well, sometimes not 🙂
Thank you Nicolas
Hi Nicolas, it´s me again. I´m obsessed with your Perfect Trend Indicator. I realized that I´m not faster than an automatic trader. So, my question is if you can program this indicator to operate automatically with some paramethers of buying and saling and with a daily task. If you can do it please let me know how we can do that.
Sure it’s possible, please ask your query in the automatic trading forum (ProOrder) in order to get replies from members. I’m still on leave, so please be patient if no one answer your query in the mean time.
Hi Nicolas,
in your opinion, why is it the “perfect” trend indicator?
Thanks in advance
It’s the name of the original code, not my opinion.
Hi Nicolas,
when the red or blue dot is formed, is it based on the close of the current candlestick(the same bar index) or it will be formed after close of the next candlestick ?
Thanks,
Hamid
It’s based on the current Close. In real time you can wait or not for the candlestick to close or not to validate the trading signal, depends on your trading style 🙂
Hi, even if I almost understood the indicator’s theory, I am unable to translate it in ProRealCode to try open long or short positions. Would you please help me about it?
Examples of how to use the indicator in an automated trading system here : https://www.prorealcode.com/topic/perfect-trend-indicator/
Hi Nicolas,
As per my previous message above, I mentioned that the red or blue dot is formed based on the current close or next close of candle stick? I have tested with 1 minute interval, it is based on current candle stick but when I change time interval to weekly, it looks like it is based on next candle stick or bar index. For example, I was pretty sure that IBEX ( Spain 35 cash index) at weekend when market was close, there wasn’t any blue dot under a bar closed on 27 October . But this week when market opened and price move higher it shows blue dot under previous candle stick which is inconsistent with other time interval. Is here problem or issues under weekly interval?
Thanks,
Hamid
Yes I know there some issues with the weekly chart, already encountered on another indicator. It has already been reported to PRT, but you can make a report with this specific indicator behavior within the platform debug console (CTRL+M).
Perfect Trend Line screener code: https://www.prorealcode.com/topic/ayuda-screener-indicador-perfect-trend-line/#post-51291
Perfect Indicator. Thanks a lot. Hope i will get reach by using it 🙂
Bonjour Nicolas,
peut on transformer cet indicateur en strategie
super travail
Quelque chose a déjà été travaillé ici: https://www.prorealcode.com/topic/perfect-trend-indicator/
Tu peux partir de cette base et la modifier / améliorer à volonté, on attend des retours de ta part 🙂
Hello Nicolas,
thank you for the code of the ‘perfect trend line’ indicator. As a daytrader on the 10, 15 and 30 min charts it confirms the reversals very nice.
One question. I trade several stocks and some indices. Is there a possibility that i can get a alert when a blue or red dot appears?
thank you in advance
kind regards,
Sjoerd
You can use the screener posted here: Perfect Trend Line screener code: https://www.prorealcode.com/topic/ayuda-screener-indicador-perfect-trend-line/#post-51291
Thank you nicolas
Bonjour Nicolas,
sur quelle échelle de temps minimum tu utilises l indicateur
je pense 4H ou 1H
Bonjour Nicolas
Pour créer la strategie comment peux tu traduire l”apparition des points.
Acheter ou vendre lors de l’apparition des points
merci
Exemple dans ce sujet du forum ProOrder : https://www.prorealcode.com/topic/perfect-trend-indicator/
how to automate Drawn line between 2 red point and 2 blue points?
I don’t understand your query. Could you please create a topic in forum with a complete explanation?
I like to automate Drawn trend line between 2 High point on your “PRC_PerfectTrendLine” chart.
and trend line between 2 lower point on your “PRC_PerfectTrendLine” chart.
You can find an automated trading code in this topic: https://www.prorealcode.com/topic/s-o-s-perfect-trend-line/#post-86009
Thank you. I have a look
how to generate alert sound or mail for this when blue or red dot is formed, I dont see any option such support or resistance or buy or sell option in the selection list
change the last line with
return line1 coloured(r,g,b,100) style(line,1),line2 coloured(r,g,b,100) style(line,1), r
and check in the alert tools if r is equal to 200 (red) or 30 (green)
Hello Nicolas,
Re: alerts, you wrote:
“and check in the alert tools if r is equal to 200 (red) (I changed mine to 250) or 30 (green)”
But there is no “=,” but there is “>=” or “=” value 250 or 30 produced two alerts but nowhere near the dots on my 3 tick chart?
Pls see two arrow alerts at bottom price chart to the left nowhere near ptl dots: https://www.dropbox.com/s/0yxj8v1vdhpw7xf/ALERTSPERFECTTRENDLINE.png
When the dots are formed there is no alert sound, so how do I express that within the alerts feature if I can’t see “r” in the dropdown box?: (I have re-added the indicator to the price chart just to make sure that “r” is effective).
https://www.dropbox.com/s/tm98dxlj5a88n9c/ALERTSPERFECTTRENDLINE2.png
Also, when I go to Display/Alerts Status, now I don’t see anyway of creating a new alert on a different chart by clicking within that chart?
Alerts Status just opens up but I can’t get a bell in the new second chart for another indicator/screener when I click on the chart?
Cheers,
https://www.prorealcode.com/topic/ayuda-screener-indicador-perfect-trend-line/#post-51291
* The edit didn’t work on my previous comment.
” but there is “>=” or “=” value 250 or 30 produced two alerts but nowhere near the dots…” should have read:
but there is “>=” or “=” value. When I set fast trendline >= to value 250 or 30 it produced two alerts but nowhere near the dots…
Bonjour Nicolas,
suite a une de mes precedentes demande dans le forum indicateur, j’ai touve celui-ci pour creer le screener Perfect Line Trade
https://www.prorealcode.com/topic/ayuda-screener-indicador-perfect-trend-line/#post-51291
J’ai teste ce matin et il m’a bien remonte les valeurs ayant eu un point bleu sur la journee d’hier.
Ce soir, je teste et il me ressort les meme valeurs avec une journee de plus et pas de nouvelles alors que McPhy a un point bleu ajourd’hui ?!
Un p’tit coup de main 🙂
Merci d’avance
C’est selon moi le meilleur indicateur, que j’ai vu, si vous trouvez mieux dîtes moi car difficile de faire beaucoup mieux 😀 Mais je ne comprend pas exactement à quoi servent les lignes rouges et bleus ? (elle servent pour le signal, j’imagine, et font grosso modo allure de résistance et de support) mais est t il vraiment intéressant de les afficher? (ça pollue un peu le graph des fois)
Merci d’avance !!