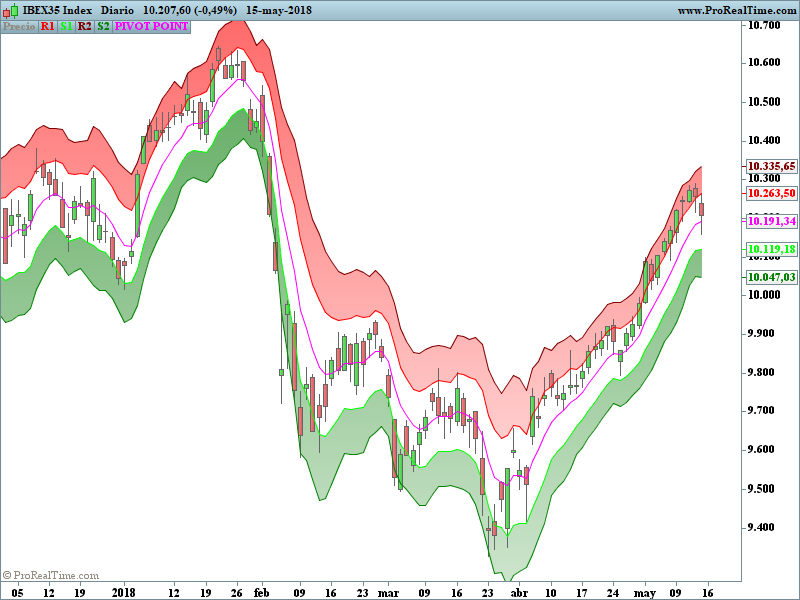
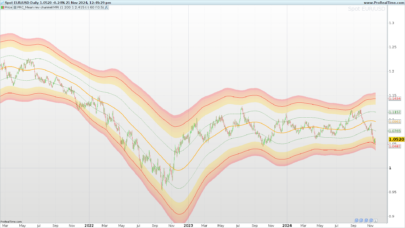
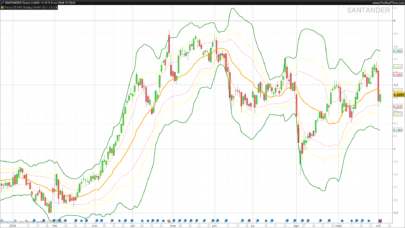
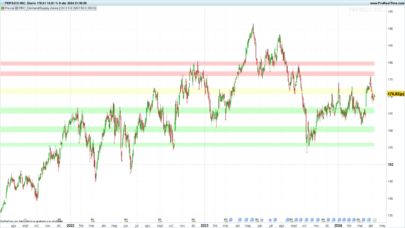
The band is smooth like a straight moving average trading band, but it also has the ability to adjust for market volatility like a Bollinger band. The width of the trading band increases gradually as the market becomes more volatile. This smooth and controlled self adjustment is key.
To create the Pivot Point Channels, I use a 7-day exponential moving average of the Pivot Points as a base. An exponential Moving Average is a little more sensitive to recent data than a straight simple moving average, however the basic principle is the same.
Next, calculate the average difference between the first Pivot Low 5 and the first Pivot High for each of the last 7 days. To do this, you subtract the first Pivot Low value from the first Pivot High value for each of the last 7 days. You then add up the difference and divide by 7. This gives you the average value of the difference between the first high and the first low pivots.
The final step involves adding this average of the differences to the moving average of the pivots to get the resistance line. As well, you subtract the average of the differences from the moving average of the pivots to get the support line. This creates a channel for the first support and resistance.
(description from the author of the indicator: Joe Duffy).
at the request of the French thread https://www.prorealcode.com/topic/pivots-points-channel/
Adaptation of a Tradingview code.
|
1 2 3 4 5 6 7 8 9 10 11 12 13 14 15 16 17 18 19 20 21 22 23 24 25 26 |
REM PIVOT BANDS //Created by ChrisMoody 11/11/2014 //Current Timeframe, Daily, Weekly, Monthly Pivot Bands //Special Thanks to Michael S. For Providing Original Code. // adapted for the platform Prorealtimev10.3 by bolsatrilera lengthMA=7 // title="EMA Length To Calculate Bands") PP = (high + low + close)/ 3 PPEMA = ExponentialAverage[lengthMA](PP) HP1 = (PP + (PP-low)) LP1 = (PP - (high-PP)) HP2 = (PP + 2*(PP-low)) LP2 = (PP - 2*(high-PP)) // PPD71 = Difference from HP1 and LP1 for the last 7 days PPD71 = (((HP1-LP1)+(HP1[1]-LP1[1])+(HP1[2]-LP1[2])+(HP1[3]-LP1[3])+(HP1[4]-LP1[4])+(HP1[5]-LP1[5])+(HP1[6]-LP1[6]))/7) // PPD72 = Difference from HP2 and LP2 for the last 7 days PPD72 = (((HP2-LP2)+(HP2[1]-LP2[1])+(HP2[2]-LP2[2])+(HP2[3]-LP2[3])+(HP2[4]-LP2[4])+(HP2[5]-LP2[5])+(HP2[6]-LP2 [6]))/7) r1 = PPEMA + PPD71 s1 = PPEMA - PPD71 re2 = PPEMA + PPD72 s2 = PPEMA - PPD72 return r1 coloured(255,0,0)as "R1",s1 coloured(0,255,0)as "S1",re2 coloured(128,0,0)as "R2",s2 coloured(0,128,0)as "S2", PPEMA coloured(255,0,255)as "PIVOT POINT" |
Share this
No information on this site is investment advice or a solicitation to buy or sell any financial instrument. Past performance is not indicative of future results. Trading may expose you to risk of loss greater than your deposits and is only suitable for experienced investors who have sufficient financial means to bear such risk.
ProRealTime ITF files and other attachments :PRC is also on YouTube, subscribe to our channel for exclusive content and tutorials







Hola?.
Exactamente cuál es su utilización?.
Hola Juanjo, su principio esparecido a las bandas de Bollinguer.Las lineas de las bandas son los pivots que se pueden utilizar como soportes/resistencias.